ABC Inventory Analysis: How to Rank Your SKUs
RedHub AI Editorialupdated September 7, 20265 min read

Jump to a section9
TL;DR
- What it is: ABC inventory analysis ranks your SKUs by revenue contribution into three bands — A, B, and C — so you focus attention on the vital few.
- Who it's for: Shopify and Amazon operators with more SKUs than hours to review each one individually — see the Ecommerce Skills Pack.
- How it works: sort SKUs by revenue, then classify the top slice as A, the next slice as B, and the rest as C.
- Bottom line: most of your catalog doesn't need weekly attention. ABC analysis tells you exactly which SKUs do.
What is ABC inventory analysis?
ABC inventory analysis is a way of ranking your product catalog by how much revenue each SKU contributes, then sorting them into three bands: A-class SKUs (typically the top ~80% of revenue), B-class (the next ~15%), and C-class (the remaining ~5%). It's a version of the Pareto principle applied to inventory — a small number of products usually drive most of your revenue, and ABC analysis tells you exactly which ones.
Best for: catalogs with dozens or hundreds of SKUs where reviewing every product equally isn't realistic — see the Ecommerce Skills Pack ($89).
A catalog with 400 SKUs doesn't need 400 equal decisions every week. Some products drive most of your revenue and deserve constant attention. Others barely move and can go weeks without a second thought. ABC inventory analysis is the method for telling the two apart.
What ABC inventory analysis actually measures
The math is simple. Take your sales data, calculate revenue per SKU over a set period, and sort from highest to lowest. Then draw two lines: one after the SKUs that together make up roughly 80% of revenue (A-class), one after the next chunk that makes up roughly 15% more (B-class), leaving the rest as C-class. The exact percentages vary by catalog — the point is the shape, not the precise cutoff.
The three bands, and what to do with each
| Band | Typical share of revenue | What it means | What to do |
|---|---|---|---|
| A | ~80% | Your vital few — a small number of SKUs driving most of the business | Review weekly; never let these go out of stock |
| B | ~15% | Steady contributors, not urgent but not ignorable | Review monthly; keep reasonable safety stock |
| C | ~5% | The long tail — many SKUs, small individual impact | Review quarterly; watch for dead stock worth clearing |
How to run it
- Pull revenue and units per SKU over a consistent period — 90 days is a common window that smooths out one-off spikes.
- Sort SKUs from highest to lowest revenue and calculate the running cumulative percentage of total revenue.
- Draw your A/B/C lines at roughly 80% and 95% cumulative revenue — adjust for your own catalog shape rather than forcing an exact 80/15/5 split.
- Flag anomalies as you go — a normally-C SKU that spiked last month, or an A-class SKU quietly trending down, both deserve a second look outside the standard band.
- Turn the result into a weekly action list, not a static spreadsheet you run once and forget.
Key insight: ABC analysis is only useful if you re-run it. A catalog's revenue mix shifts with seasonality and new launches — a SKU can move from B to A in a month. Treat it as a living list, not a one-time report.
What ABC analysis alone misses
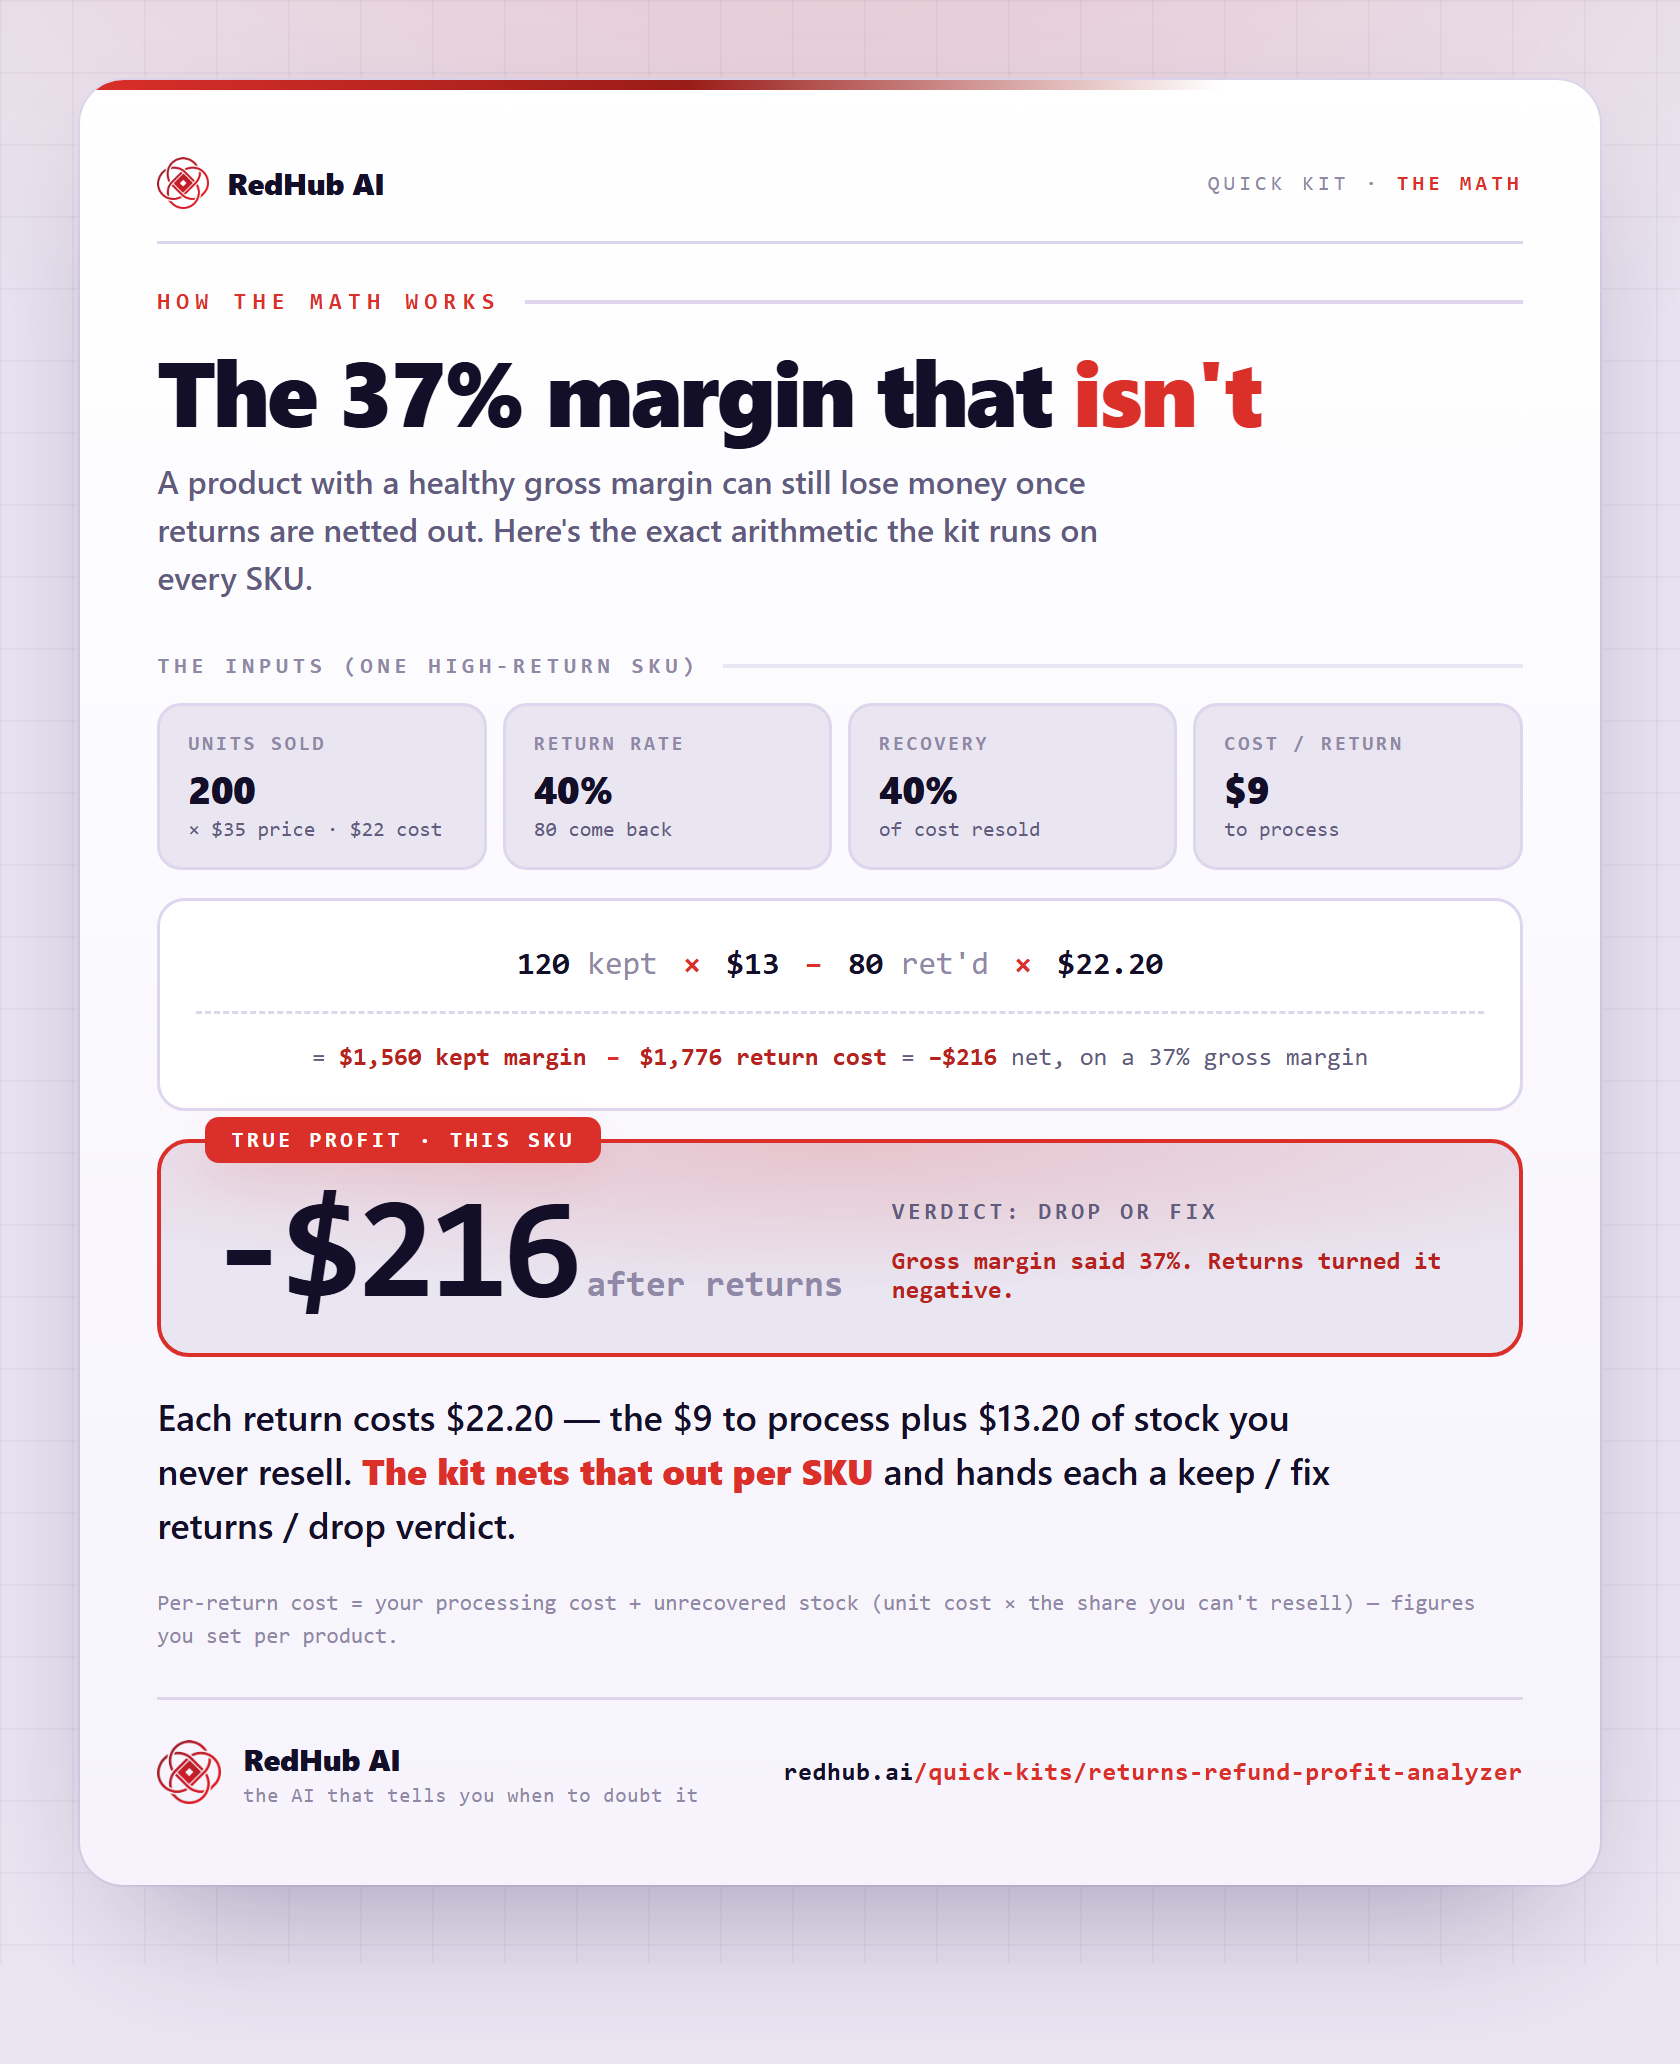
Revenue-based ranking has a blind spot: it doesn't know how much margin a SKU actually keeps after returns. A product can look like a strong A-class performer by revenue and still be quietly unprofitable once you count refunded margin, return-processing cost, and inventory you can't resell at full price. That's a different, complementary calculation — the Returns & Refund Profit Analyzer ($39) runs the true after-returns profit per SKU, so an A-class-by-revenue product that's actually losing money doesn't slip through.
Run both views together: ABC analysis tells you where the revenue concentration sits; the returns analyzer tells you whether that revenue is actually turning into profit.
Where AI helps — and where it doesn't
AI is well suited to the mechanical parts of this: pulling the sort, calculating cumulative percentages, flagging anomalies like a sudden spike or a slow bleed, and turning the output into a plain-language weekly action list instead of a static spreadsheet. What it shouldn't do is make the actual call — discounting a slow C-class SKU, discontinuing a product, or committing to a larger reorder on an A-class item is a decision with real money behind it, and that stays with a person who knows the full context: cash flow, supplier terms, seasonality.
Turn your catalog into a weekly action list
The Ecommerce Skills Pack's inventory ABC analysis skill classifies your catalog, flags dead stock and fast-movers, and outputs a prioritized weekly list — not a spreadsheet you have to interpret yourself.
Get the Ecommerce Skills Pack — $89 →Once you know which SKUs deserve attention, the next question is usually what to do about their listings and their return patterns — covered in ecommerce automation: what to automate vs. keep human and, for Amazon sellers specifically, AI for Amazon sellers. For the full six-job picture, start at AI for ecommerce: the operator jobs worth automating.
Decision Guide
Use it if: your catalog has enough SKUs that you can't review each one equally every week.
Skip it if: you carry a handful of products and already know which ones matter most without running the math.
Best first step: pull 90 days of revenue per SKU and sort it once by hand before automating the process — it helps you sanity-check the bands against your own knowledge of the catalog.
FAQ
What does ABC stand for in inventory analysis?
It's not an acronym for specific words — A, B, and C are simply the three priority bands: A for your top revenue contributors, B for steady mid-tier SKUs, and C for the long tail.
What percentage split does ABC analysis use?
A common starting point is roughly 80% of revenue in the A band, 15% in B, and 5% in C — but the exact cutoffs should be adjusted to fit your own catalog's shape, not forced to a rigid split.
How often should I re-run ABC analysis?
Monthly is a reasonable default for most stores; more often if you launch new SKUs frequently or sell a seasonal catalog. A SKU's band can shift as revenue mix changes.
Does ABC analysis account for returns and margin?
No — it ranks by revenue only. A high-revenue SKU with a high return rate can still be quietly unprofitable. Pair it with the Returns & Refund Profit Analyzer to see the after-returns picture.
Should AI decide what to discontinue based on ABC results?
No. AI can rank SKUs and flag dead stock, but the discontinue-or-reorder decision involves cash flow and supplier context that should stay with a person.
Is ABC analysis only for large catalogs?
It's most useful once you have enough SKUs that reviewing each one equally isn't realistic — often somewhere past a few dozen products, though the method works at any scale.
What tool do I need to run ABC analysis?
At minimum, a spreadsheet with revenue per SKU. An AI skill built for the job can automate the sort, the banding, and turn the result into a plain-language weekly action list.
Know which SKUs actually deserve your attention
The Ecommerce Skills Pack's ABC inventory analysis skill is one of six — alongside product descriptions, return triage, supplier negotiation, ad briefs, and review response.
Get the Ecommerce Skills Pack — $89 →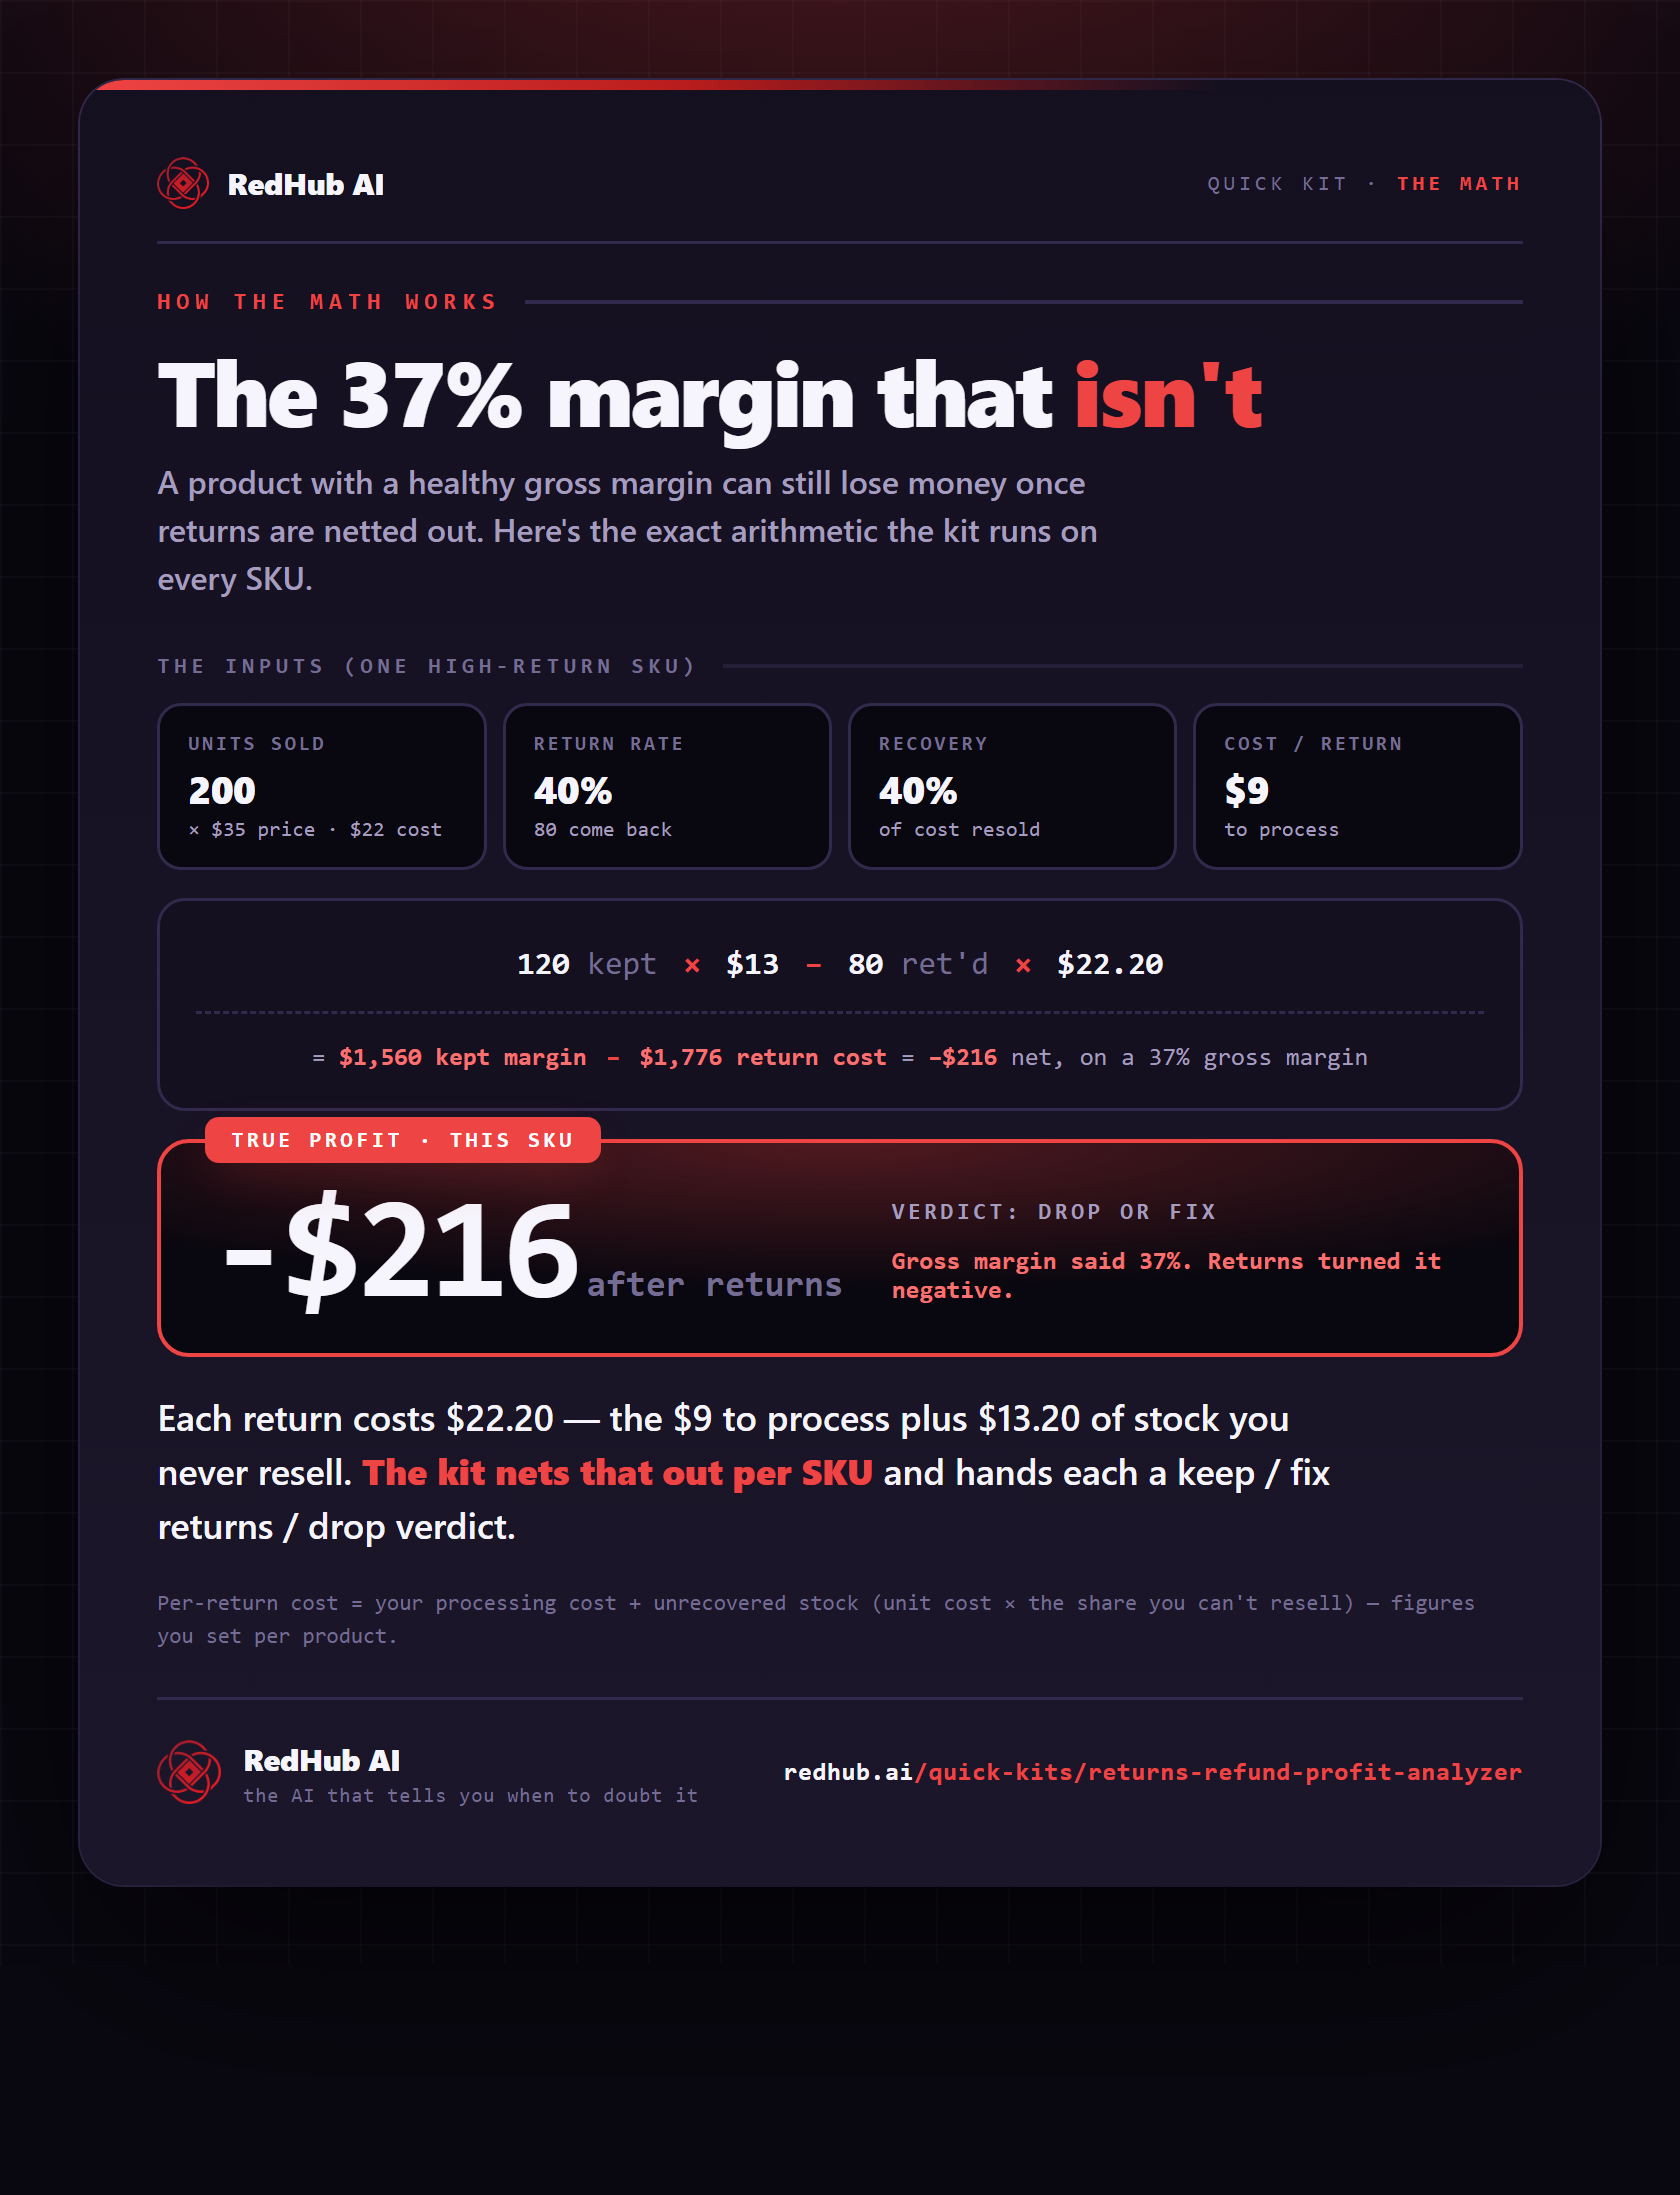
The gate this post refers to, drawn from the tool’s own logic. See the tool.