How to Read an AI Trading Bot's Performance Claim
RedHub AI Editorialupdated August 16, 20265 min read

In short
Trading vendors supply their own performance figures, so the skill is knowing which numbers can carry meaning. A win rate says nothing about profitability without the size of losses, a return with no period is not a return, and a bare Sharpe ratio is decoration. Backtests describe the data they were fitted to. Leverage is arithmetic: at 20x a 5 percent adverse move is the position, and no control changes that.
Jump to a section9
This is general information about how to read performance claims. It is not investment, financial or trading advice, and nothing here recommends any product or strategy. Trading leveraged cryptocurrency can lose more than the amount you deposit.
The numbers come from the seller
Automated trading products compete on published performance, and the vendor supplies the figures. That is not automatically dishonest, since the vendor holds the only complete trade log. It does mean nothing has passed anyone whose job is to doubt it.
So the skill is not judging whether a specific number is true. It is knowing which numbers can carry meaning at all, and which are shaped so they cannot.
A win rate is not a performance figure
The share of trades that closed positive says nothing about profitability, because it says nothing about size. A system that wins nine times in ten and loses more on the tenth than it made on the nine is a losing system with an excellent win rate.
This is why win rate is the most advertised metric in the category and the least informative. It is bounded, it looks like a grade, and it can be pushed upward by taking profits early and letting losses run, which is exactly the behavior that produces the tenth trade.
The figures that mean something pair outcomes with magnitude: average win against average loss, profit factor, and the largest drawdown. A vendor publishing a win rate and withholding drawdown has told you which number was more flattering.
A return with no period is not a return
A percentage means nothing until you know the span it covers, the capital base, and the market conditions. The same figure can describe a strong multi-year record or one lucky month inside a broad rally.
Conditions matter more here than in most asset classes. A strategy that buys dips mechanically looks brilliant across any period that trended up and looks different across one that did not. When a result omits its window, the window is doing work the number takes credit for.
A Sharpe ratio needs its inputs
Sharpe expresses return above a risk-free rate per unit of volatility, and it is comparable only when the period, the sampling frequency and the risk-free assumption are stated. Change any of them and the number moves without the strategy changing.
Quoted bare, it is decoration. It is also inflatable by sampling more frequently, which published figures rarely disclose.
Backtests describe the past they were fitted to
Any strategy can be tuned until it performs superbly on historical data, because the parameters were chosen with that data visible. The result describes the fitting, not the future.
What separates a meaningful backtest from a decorative one is whether performance was measured on a period held back from tuning, and whether realistic costs, spreads and slippage were charged. Most published results state neither. The category also has a survivorship problem: products that performed badly stop being marketed, so the visible field is filtered toward whatever recently worked.
Leverage math does not bend
Leverage multiplies outcomes in both directions. At 20x, a 5 percent adverse move is the entire position. That is arithmetic, not a risk setting, and no control changes it.
Automated risk management acts faster than a person. It can size positions, place stops and cut exposure without hesitating. What it cannot do is make a leveraged loss smaller than the market made it. Stops are not guaranteed fills, and in a fast or thin market price moves through the level, closing worse than intended or not at all. Gaps do not wait for a system to react.
Describing high leverage as safe because software manages it substitutes a claim about reaction speed for a claim about exposure. Those are different things.
The complication
Everything above is a case for skepticism, and skepticism applied uniformly is its own error.
Automation removes a real problem, which is that people trade badly under emotion. A mechanical system that executes a mediocre plan consistently can beat a good plan executed by someone panicking, and that benefit is real even when the marketing around it is not.
So the honest position is narrower than dismissal. The consistency claim is plausible and testable. The outperformance claim is the one carrying unsourced numbers, and those two get sold together.
What an honest disclosure looks like
You are not looking for good numbers. You are looking for numbers shaped so they could be wrong: a stated period, a stated capital base, costs included, drawdown published beside return, and a clear statement of whether results are live or simulated.
Where those are missing, the correct reading is not that the product is bad. It is that no checkable claim was made, so there is nothing to evaluate. Our AI Vendor Claim & Contract Scrutiny Kit ($69) grades a vendor's claims on that basis and returns a verdict on which ones are checkable.
Frequently Asked Questions
Is a high win rate a sign of a profitable trading bot?
No. A win rate counts how many trades closed positive and says nothing about the size of wins and losses. A system winning nine trades in ten loses money overall if the tenth loss exceeds the nine gains. It is the most advertised metric because it looks like a grade, and it can be raised by taking profits early and letting losses run.
Which figures indicate performance?
Ones pairing outcomes with magnitude and context: average win against average loss, profit factor, maximum drawdown, and the period covered. Drawdown matters most, since it describes the worst stretch a holder had to sit through. A published win rate with no drawdown beside it indicates which of the two was more flattering.
Why is a backtest weak evidence?
Because parameters were chosen with the historical data already visible, so strong results partly describe the fitting process. A backtest carries weight only when performance was measured on a period held back from tuning and realistic costs, spreads and slippage were charged. The category also has survivorship bias, since products that performed badly stop being marketed.
Can automated risk management make high leverage safe?
No. Leverage multiplies gains and losses identically, and at 20x a 5 percent adverse move is the whole position. Automation can size positions and place stops faster than a person, but cannot make a leveraged loss smaller than the market made it. Stops are not guaranteed fills, and in fast or thin markets price moves straight through the level.
Is there a real case for automated trading?
Yes, and it is narrower than the marketing. Automation removes emotional execution, and a mechanical system running a mediocre plan consistently can beat a good plan executed by someone panicking. That consistency claim is plausible and testable. The outperformance claim is the one carrying unsourced numbers, and the two are usually sold together.
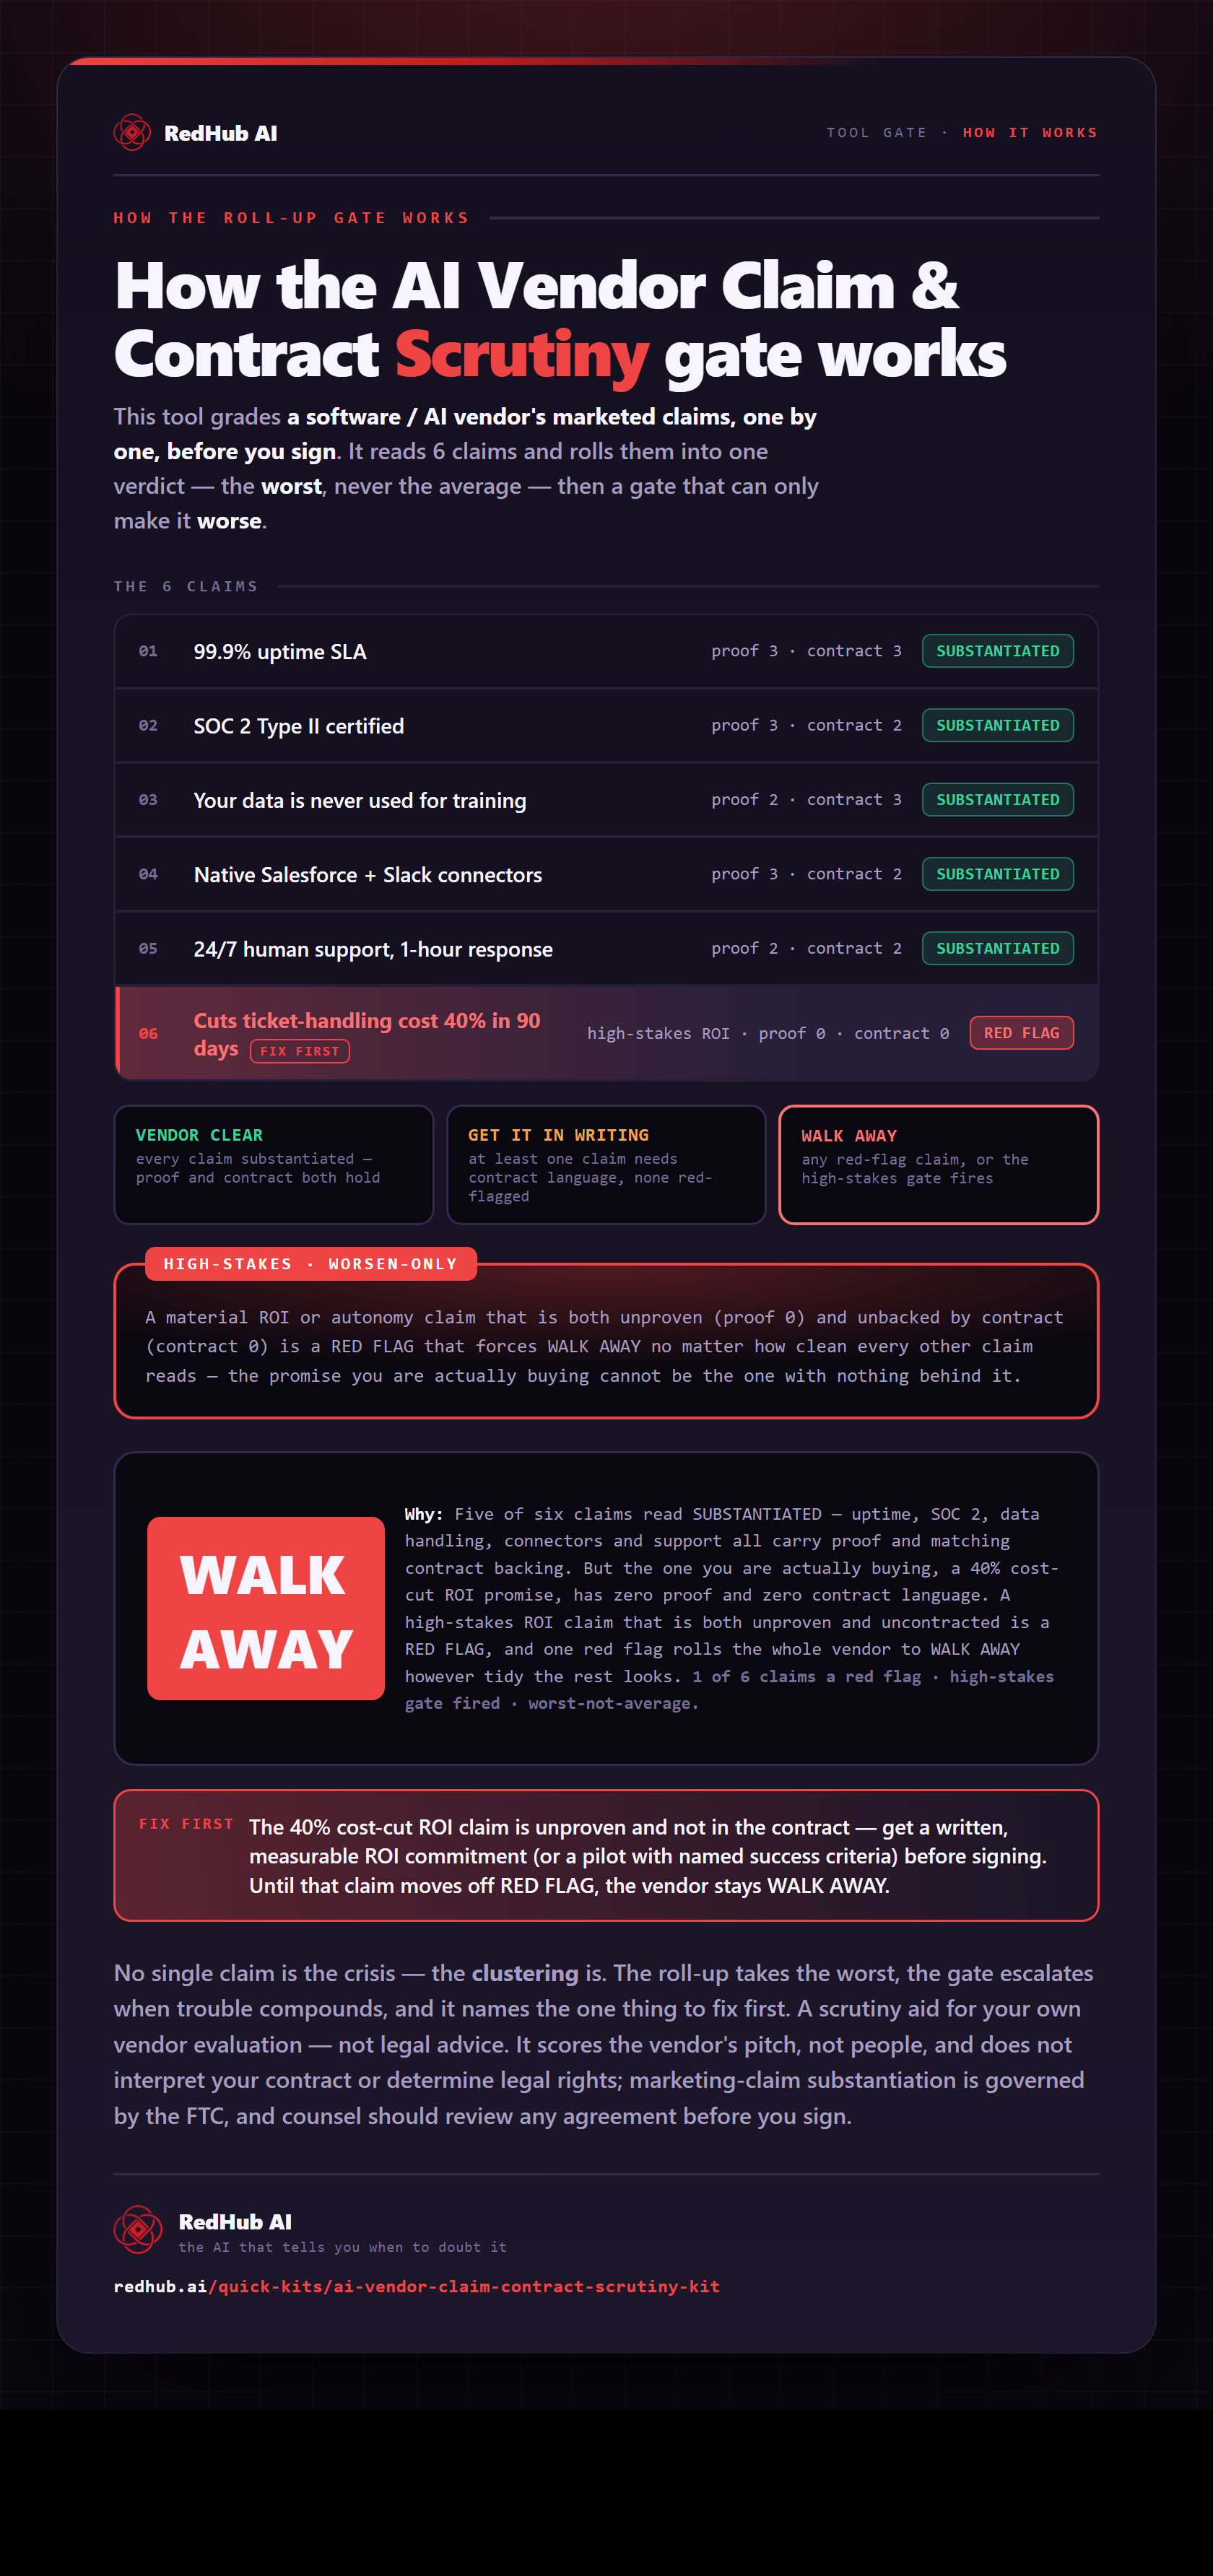
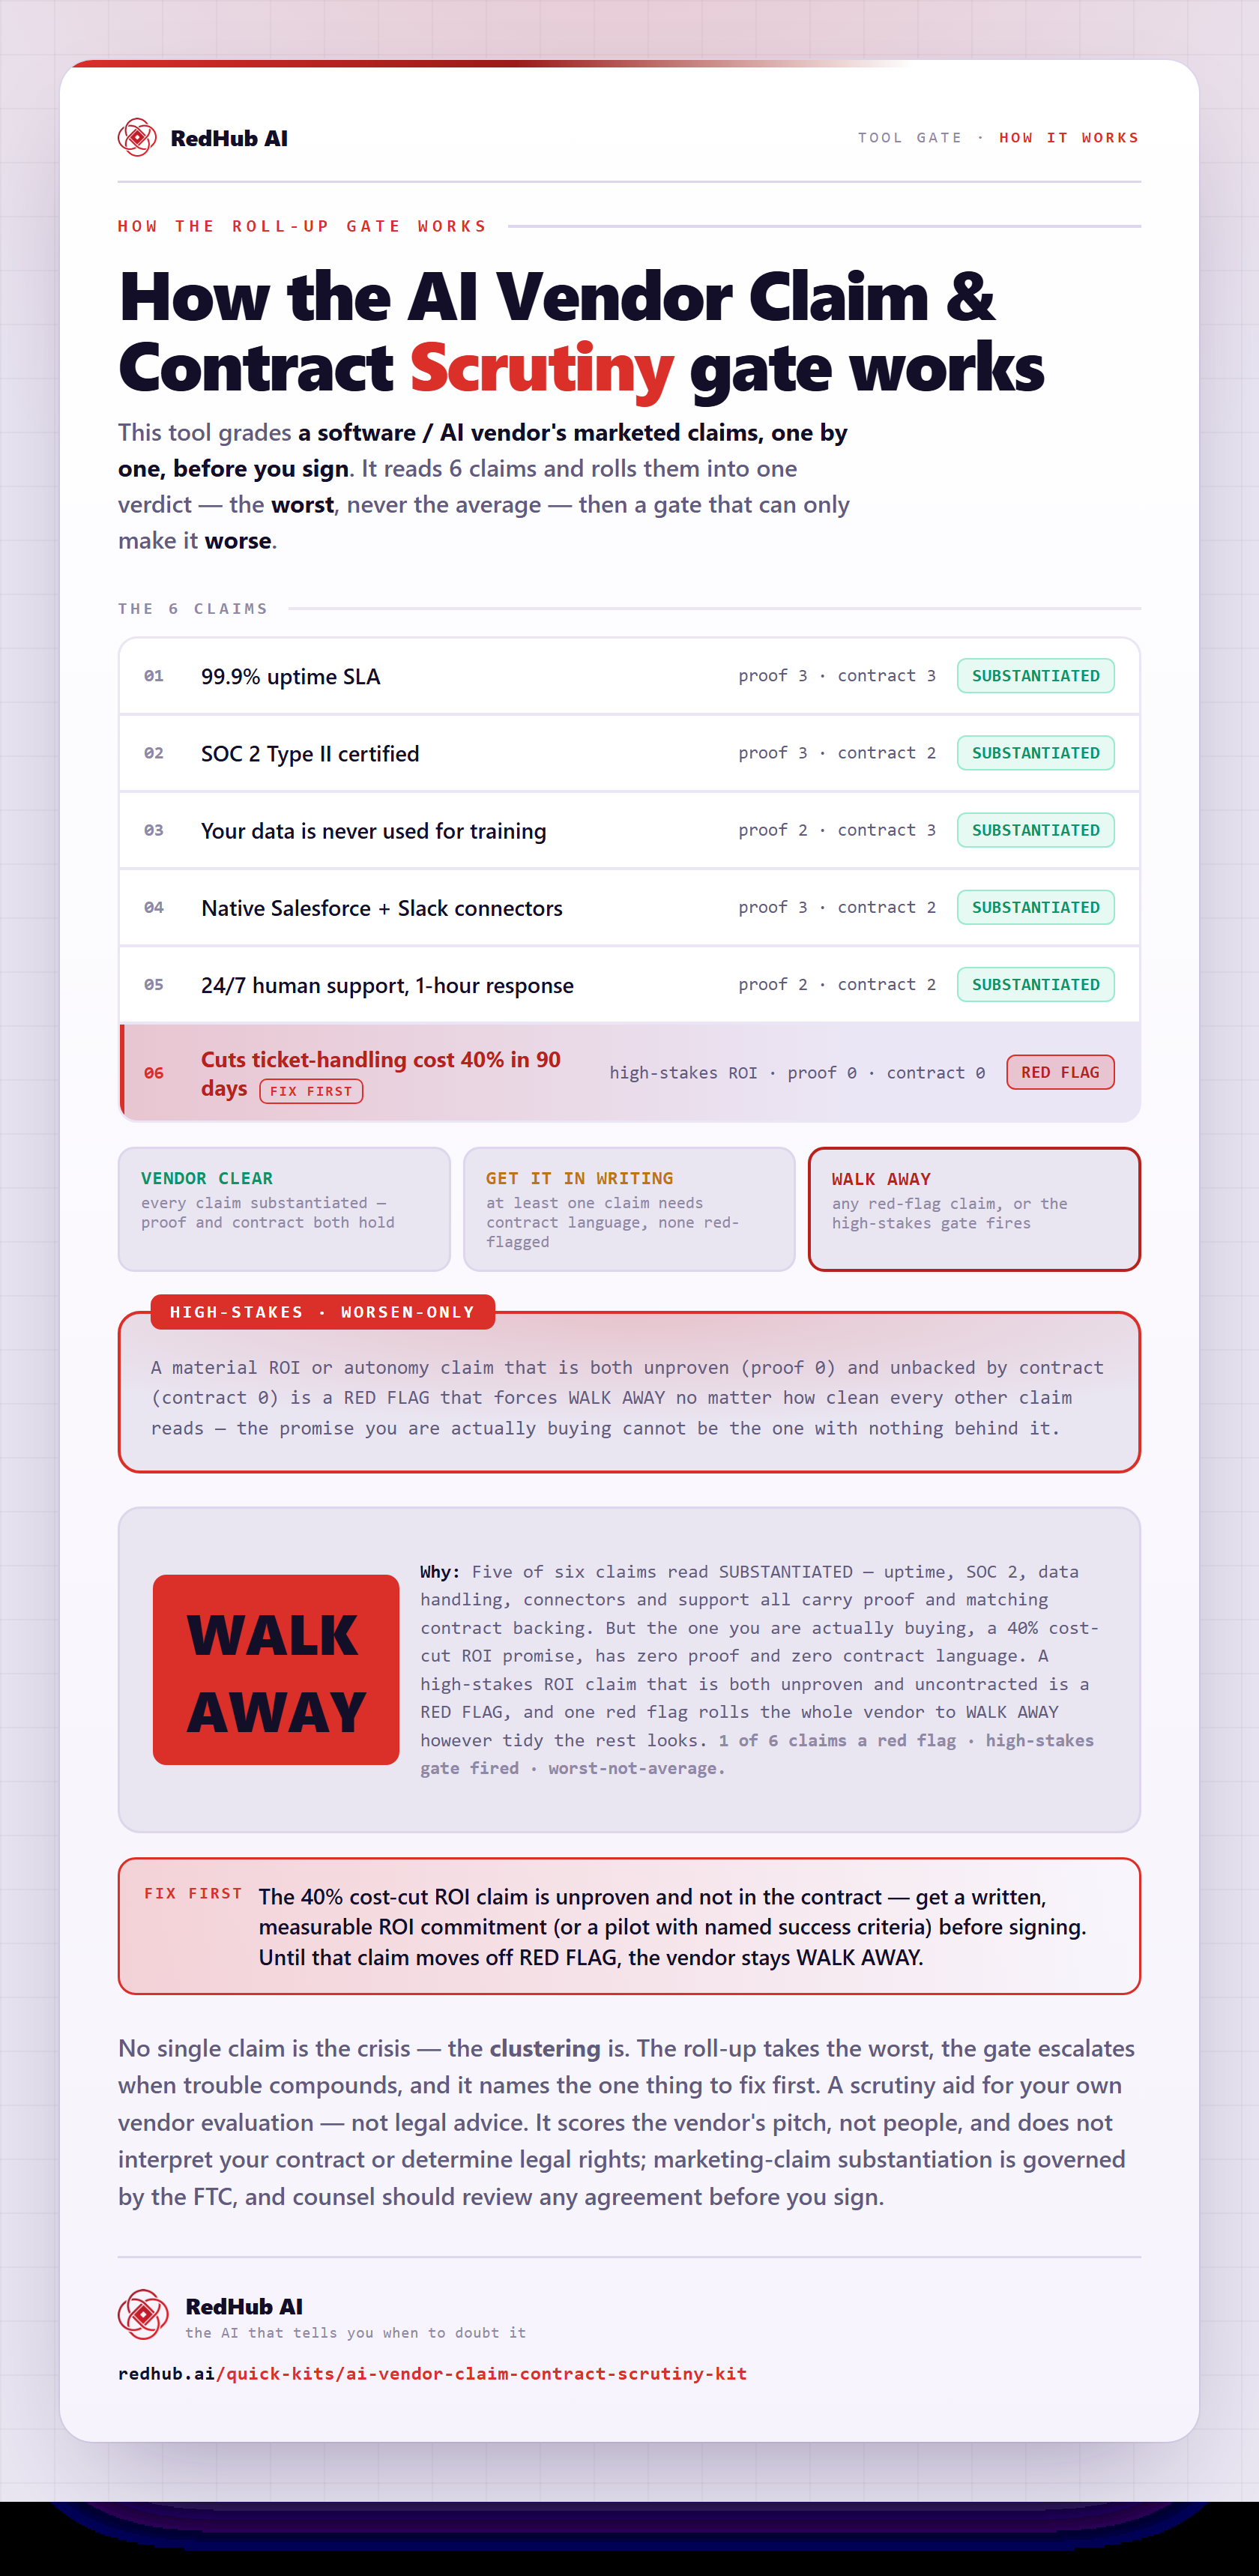
The gate this post refers to, drawn from the tool’s own logic. See the tool.