The Marketing Metrics That Actually Predict Revenue
RedHub AI Editorialupdated September 20, 20264 min read

Jump to a section6
The marketing metrics that actually predict revenue are the ones that sit closest to a closed deal in your sales process — qualified leads, cost per qualified lead, close rate by source, and sales-cycle length by channel. Everything upstream of those (impressions, traffic, engagement) is only useful to the extent it reliably feeds them.
TL;DR: Revenue-predictive metrics are the ones that move a few weeks before revenue does and hold up when you check them against what actually closed. The four worth building your reporting around: qualified leads generated, cost per qualified lead, close rate by source, and payback period. Track fewer metrics, and track the ones that are close enough to the deal to actually mean something.
What Makes a Metric "Revenue-Predictive"
A metric earns a spot on your core dashboard when two things are both true: it moves in a way that reliably precedes revenue movement, and it holds up when you check it against what actually closed. A metric that goes up while revenue stays flat for several periods running has failed that test, no matter how intuitive it feels.
Four Metrics Worth Building a Report Around
- Qualified leads generated: Not raw leads — leads that meet your actual buying-stage and fit criteria. This is the first number in the chain that correlates with revenue instead of just activity.
- Cost per qualified lead (by channel): Tells you where a marketing dollar is producing something the sales team can actually work, not just where it's producing clicks.
- Close rate by source: Some channels produce leads that close at a much higher rate than others, even at a higher cost per lead — this metric is how you catch that.
- Payback period: How long it takes for a customer's revenue to cover the cost of acquiring them. A channel with a fast payback period funds its own growth; one with a slow payback period is a bet on the future.
Leading Indicators Worth Watching (Even Though They're Not Revenue Themselves)
Engagement-layer metrics like demo requests, reply rates, and repeat-visit rate are useful as early warning signals — they tend to move a few weeks before the revenue-layer metrics do. Use them to catch a problem early, not as a substitute for checking the revenue-layer numbers.
How to Build the Habit of Checking Correlation, Not Just Trend
- Once a quarter, pull your top 3–5 reported metrics next to actual revenue for the same period.
- Ask which ones moved in the same direction as revenue, and which ones didn't.
- Demote any metric that's decoupled from revenue for two quarters running — move it to a monthly brand-health note instead of the weekly report.
- Promote any engagement-layer metric that's shown a consistent lead-time relationship with revenue into your core weekly set.
Why Fewer Metrics Usually Predict Better
A report with four tightly-checked, revenue-correlated metrics will out-predict a report with twenty loosely-tracked ones every time, because the discipline of checking correlation doesn't scale past a handful of numbers. Pick the few that have earned their spot, and retire the rest to a quarterly appendix.
Pairs well with Pipeline Commander once qualified leads move into active pipeline, and the AI Overview Traffic-Loss Diagnostic if your qualified-lead volume from organic search has been quietly slipping.
More in this guide
Can any tool give me perfect attribution?
No — even the four revenue-predictive metrics here are directional signals checked against correlation over time, not a guaranteed forecast. Treat them as a defensible read, not a precise prediction.
What's the single best marketing metric to track?
There isn't one universal answer — it's whichever metric in your funnel has the tightest, checked correlation with your actual closed revenue, which varies by business and should be verified, not assumed.
Are engagement metrics like demo requests worth tracking?
Yes, as leading indicators — they often move a few weeks before revenue-layer metrics do, which makes them useful for catching a problem early, not as a stand-in for the revenue numbers themselves.
How do I know if a metric I'm tracking actually predicts revenue?
Check it against actual closed revenue over a few periods. If it moves in the same direction consistently, it's predictive; if it's decoupled for two quarters running, demote it.
Should I track different metrics for different channels?
The four core metrics (qualified leads, cost per qualified lead, close rate, payback period) apply across channels, but compare them within a channel over time and against other channels, not against an external universal benchmark.
How does the AI Marketing Measurement Kit help pick the right metrics?
It gives a lean team a structured way to identify which metrics in their own funnel actually correlate with revenue and build a monthly reporting cadence around just those.

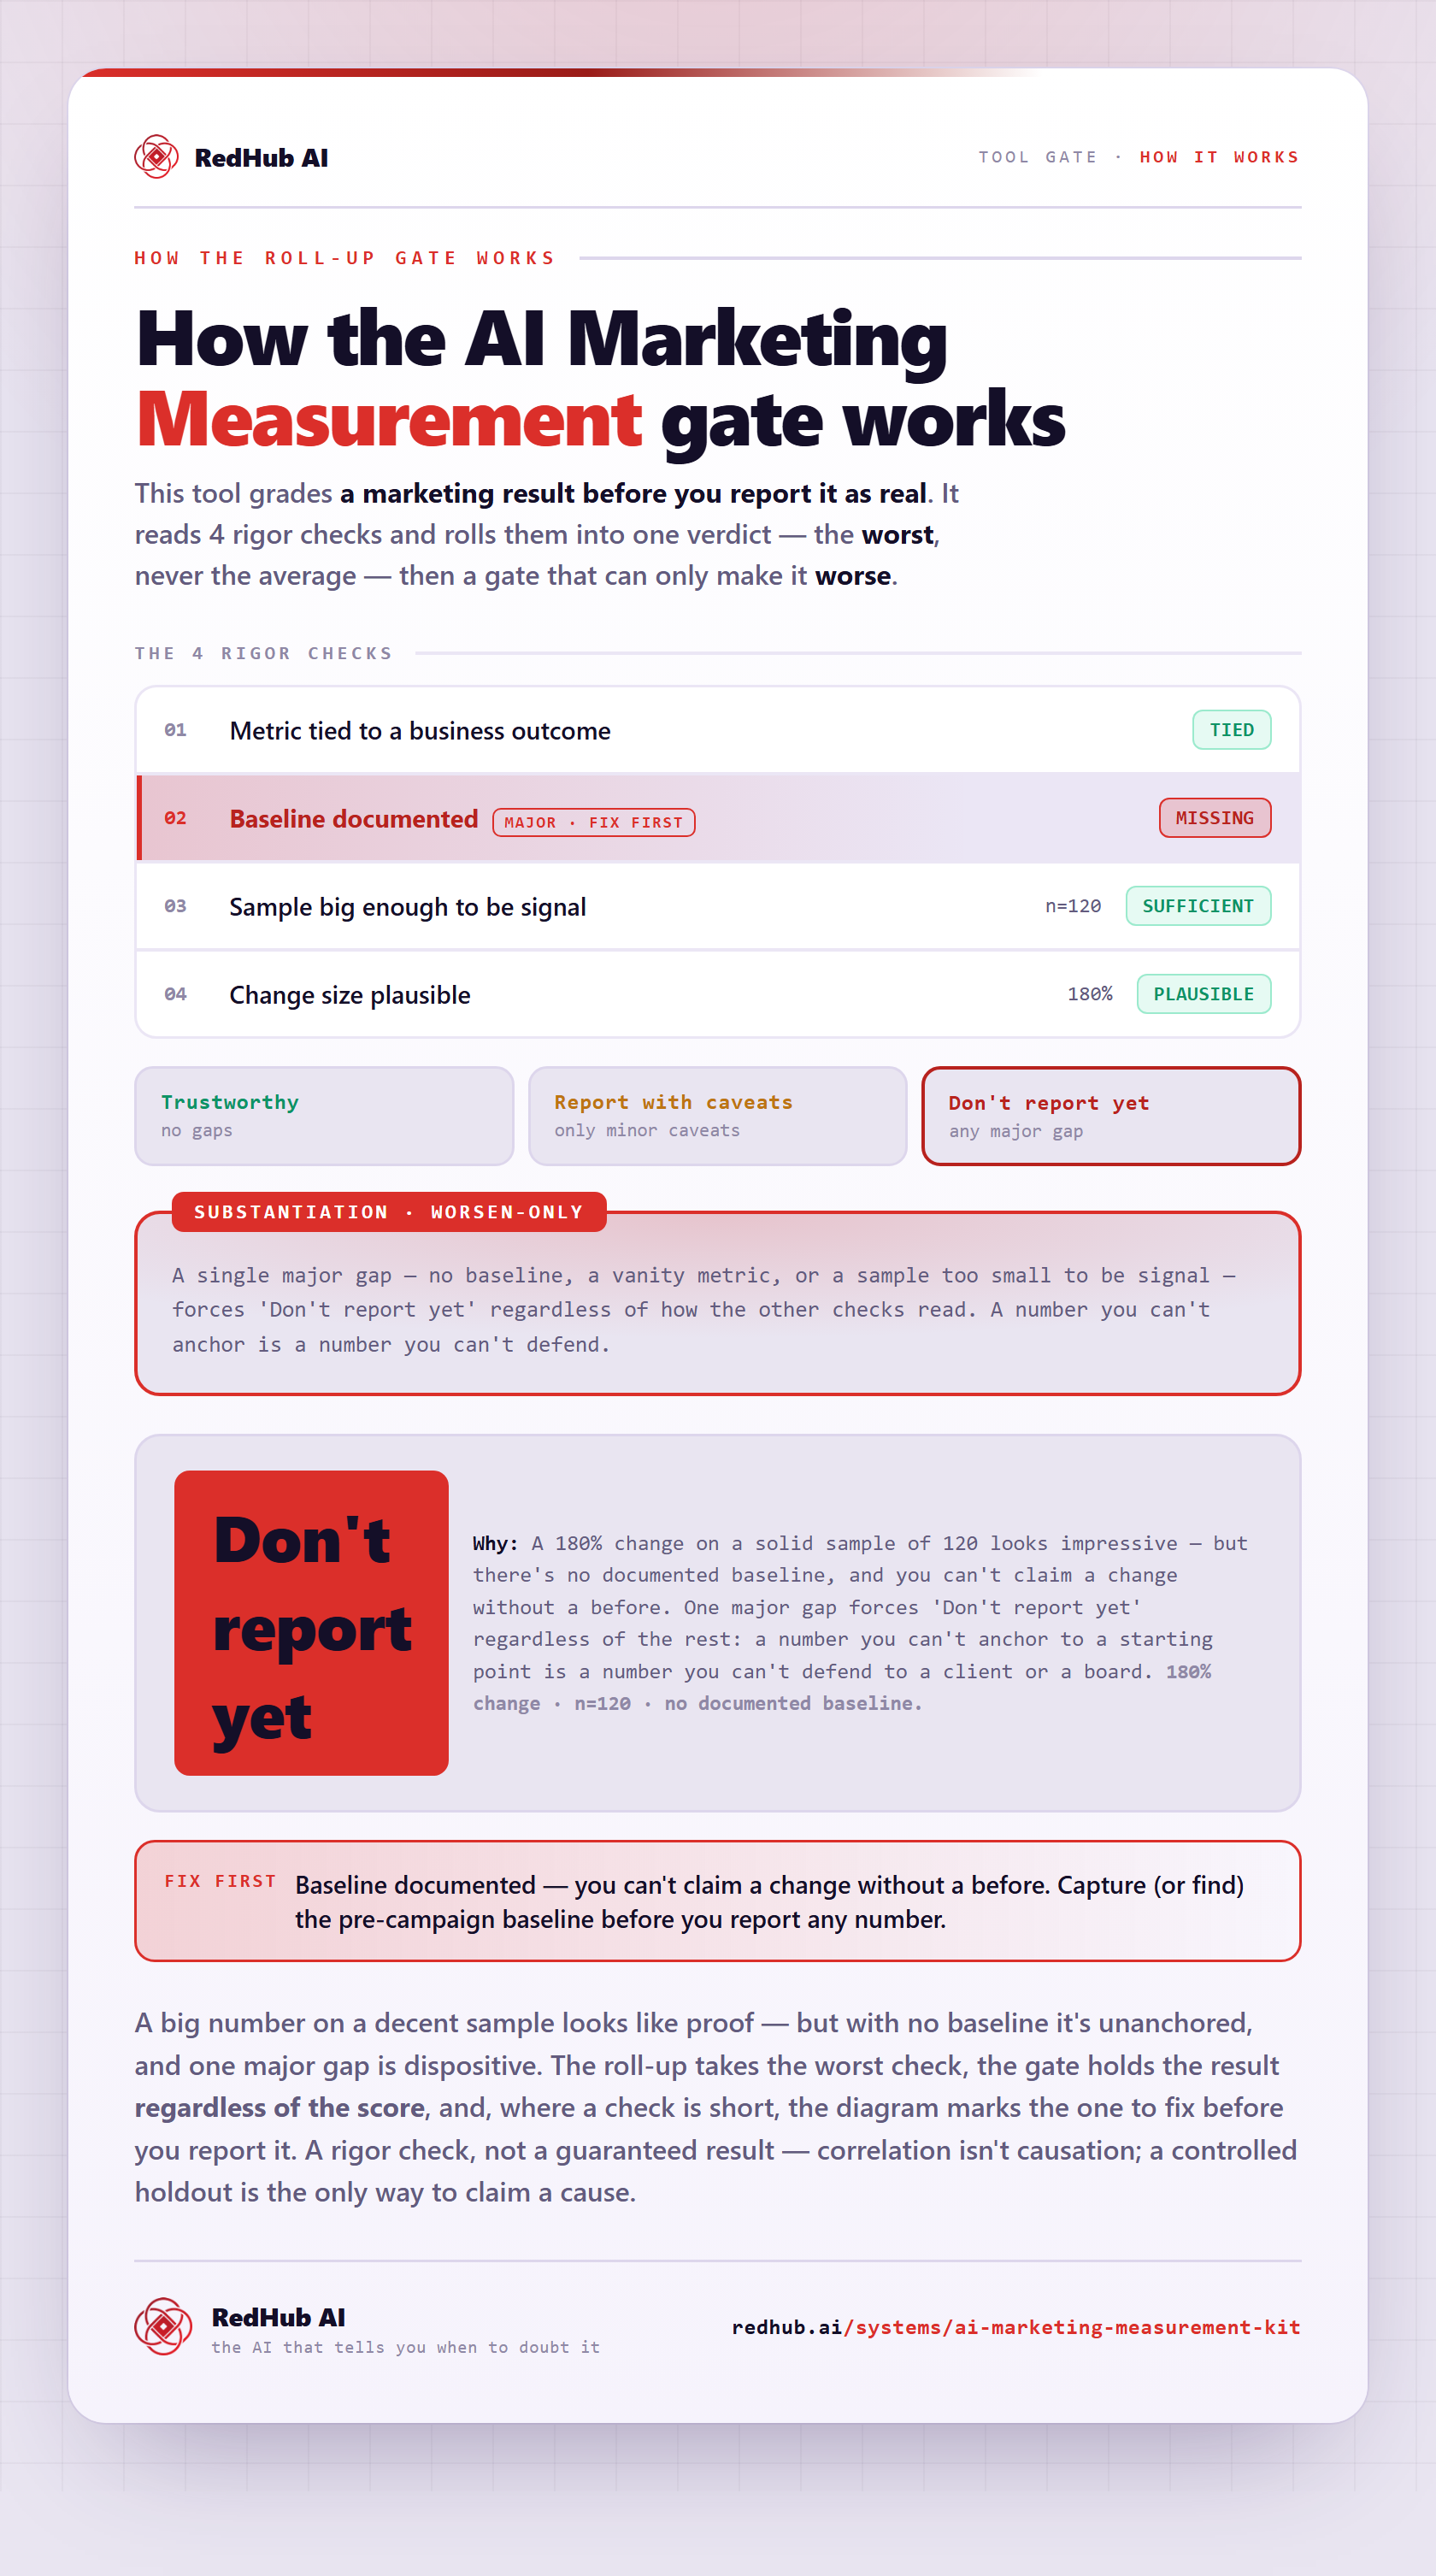
The gate this post refers to, drawn from the tool’s own logic. See the tool.