How to Measure Promotion ROI Honestly
RedHub AI Editorialupdated October 4, 20265 min read

Jump to a section6
Three reports can describe the same promo and reach three different verdicts. The revenue report says it worked. A one-week margin report says it lost a little. A report that includes the week after says it lost almost twice as much. Promotion ROI, measured honestly, is the third one: the margin the whole promo window earned, minus the margin the same weeks would have earned with no promo, using a cautious estimate of how many sales were new.
TL;DR: Compare promo-window margin with a no-promo baseline, not revenue with last year. Include the weeks after the promo, because pulled-forward purchases leave a dip there. In the worked example below, the same promo reads as +$1,000 in revenue, −$500 in one-week margin and −$900 once the following week is counted. Score each promo on its own, then keep, limit or kill it.
Why revenue lift is the wrong scorecard
A common promo review asks whether units or revenue went up during the promo. With a real discount on offer, the answer is often yes, so the question rarely catches anything. Volume can rise on sales you'd have made anyway, at full price, from customers who saw the discount and took it. A lift number can't see that.
The useful question is whether the promo earned more margin than doing nothing would have. Answering it needs a number no revenue report prints: your estimate of the share of promo sales that were new.
One promo, three readings
| Reading | No promo | With promo | Verdict it suggests |
|---|---|---|---|
| Revenue, promo week | $5,000 | $6,000 | +$1,000, it worked |
| Margin, promo week | $2,000 | $1,500 | −$500, a small loss |
| Margin, promo week plus the week after | $4,000 | $3,100 | −$900, a clear loss |
Each row is arithmetic on numbers you already have. They disagree because each one asks a different question, and only the last asks the right one. The 20-unit dip in the second week is next week's buyers who bought early at the discount. Leave that week out and you credit the promo with $400 it didn't earn.
If you need a ratio, divide the gap by the total discount given. The promo gave $10 off on 150 units, $1,500 in all, and finished $900 behind, a return of −60% on the discount.
How long to measure
The example stops after one week because it is made up. Your promo might not be so tidy. A product people stock up on can dip for several weeks. A promo can also lift full-price items bought in the same basket, which a per-item review never counts. Neither effect has a standard window, and we won't pretend to know yours.
A workable rule is to keep measuring until sales settle back inside their normal range, then total the margin across the whole stretch. If they never do, treat the result as provisional and say so in the review. A promo verdict is only as solid as its window.
Building an honest review, promo by promo
- Measure each promo on its own. A yearly total across all promos lets a profitable offer hide a losing one.
- Use one estimating method. Use the same comparison periods, the same post-promo check and the same new-versus-existing split, so results compare across promos.
- Lean conservative when unsure. Under-crediting a promo costs you one promo. Over-crediting one keeps funding a loss.
- Score keep, limit or kill. Not worked or didn't. A promo that loses money but reached new demand may be worth running tighter, at a lower discount, rather than cancelling.
The incremental share stays a judgment call you make. No system reports it automatically. Treat "I'm not sure" as a reason to pick the cautious figure, not a reason to skip the estimate.
Score last quarter's promos in one sheet
List each discount, coupon or sale in the Discount & Promo Profit Analyzer's Promos tab with its units, discount, price, cost and incremental estimate. The dashboard shows net margin across all promos, margin from Keep promos, margin lost to Kill promos and the discount handed to full-price buyers.
Get the Discount & Promo Profit Analyzer — $39Pairs well with
The Returns & Refund Profit Analyzer ($39) runs the same kind of review on returns, finding true profit per SKU after refunds with a keep, fix or drop verdict. The Cart-Recovery Sequence Effectiveness Gate ($49) grades your recovery flow on seven levers, discount discipline among them, for a 0-100 score banded OPTIMIZED, UNDERPERFORMING or DORMANT. If the review says discounting isn't the answer, the Should I Raise My Prices? Decision Kit ($49) tests the opposite move, with a Raise, Hold & test or Restructure verdict.
More in this guide
What's the right way to measure promotion ROI?
Compare the margin earned across the whole promo window, including the weeks after it, with the margin the same weeks would have earned with no promo. Revenue or unit lift alone can't tell you whether the promo paid.
Why isn't revenue lift a good measure of promo success?
Revenue can rise during a promo while margin falls, because the discount also goes to buyers who would have paid full price. A lift figure counts their purchases as wins.
Why include the weeks after a promo?
Some buyers move a purchase they'd have made later into the sale. That shows as extra volume during the promo and a dip afterward. Leaving the dip out credits the promo with sales it didn't create.
Should I measure ROI per promo or for the whole year?
Per promo. A yearly total can hide offers that lose money behind others that make it.
What if I'm not confident in my incremental-share estimate?
Use a cautious figure rather than skipping the estimate. Under-crediting a promo costs little. Over-crediting one keeps funding a loss.
Can the Discount & Promo Profit Analyzer do this calculation?
Yes. Enter units, discount, regular price, unit cost and your incremental estimate for each promo. It returns net margin versus no promo and a keep, limit or kill verdict, and totals the discount handed to full-price buyers.
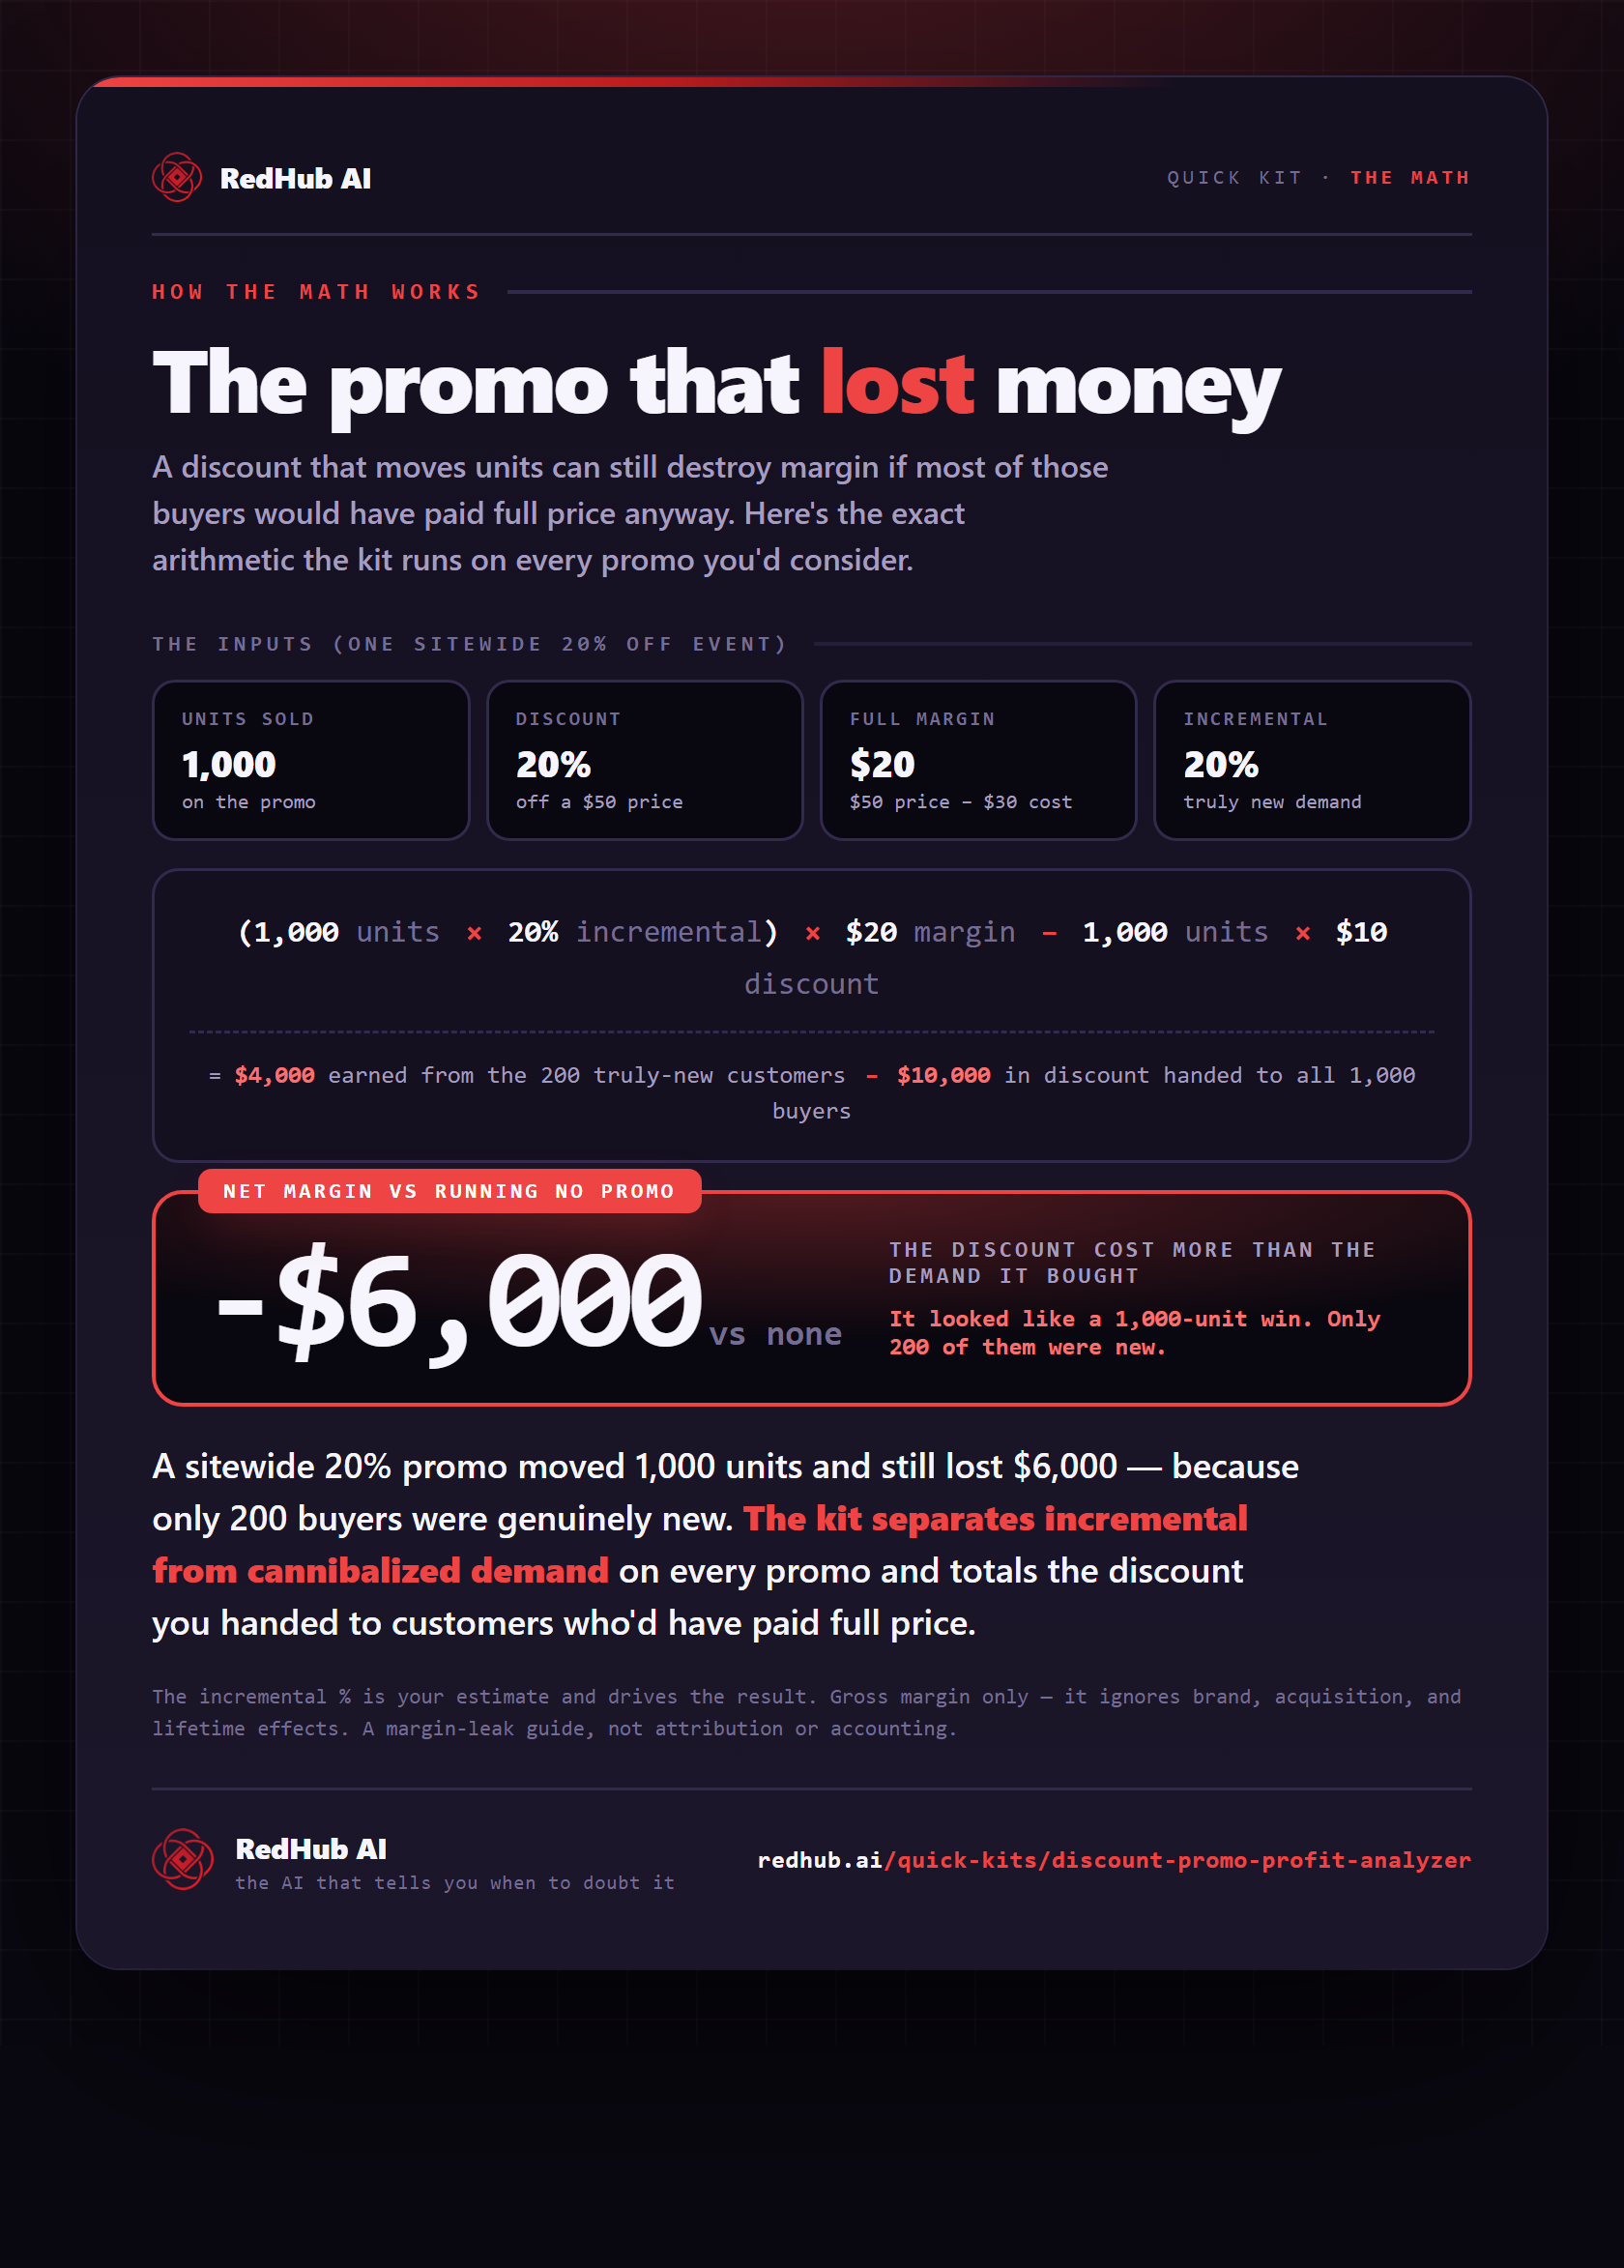
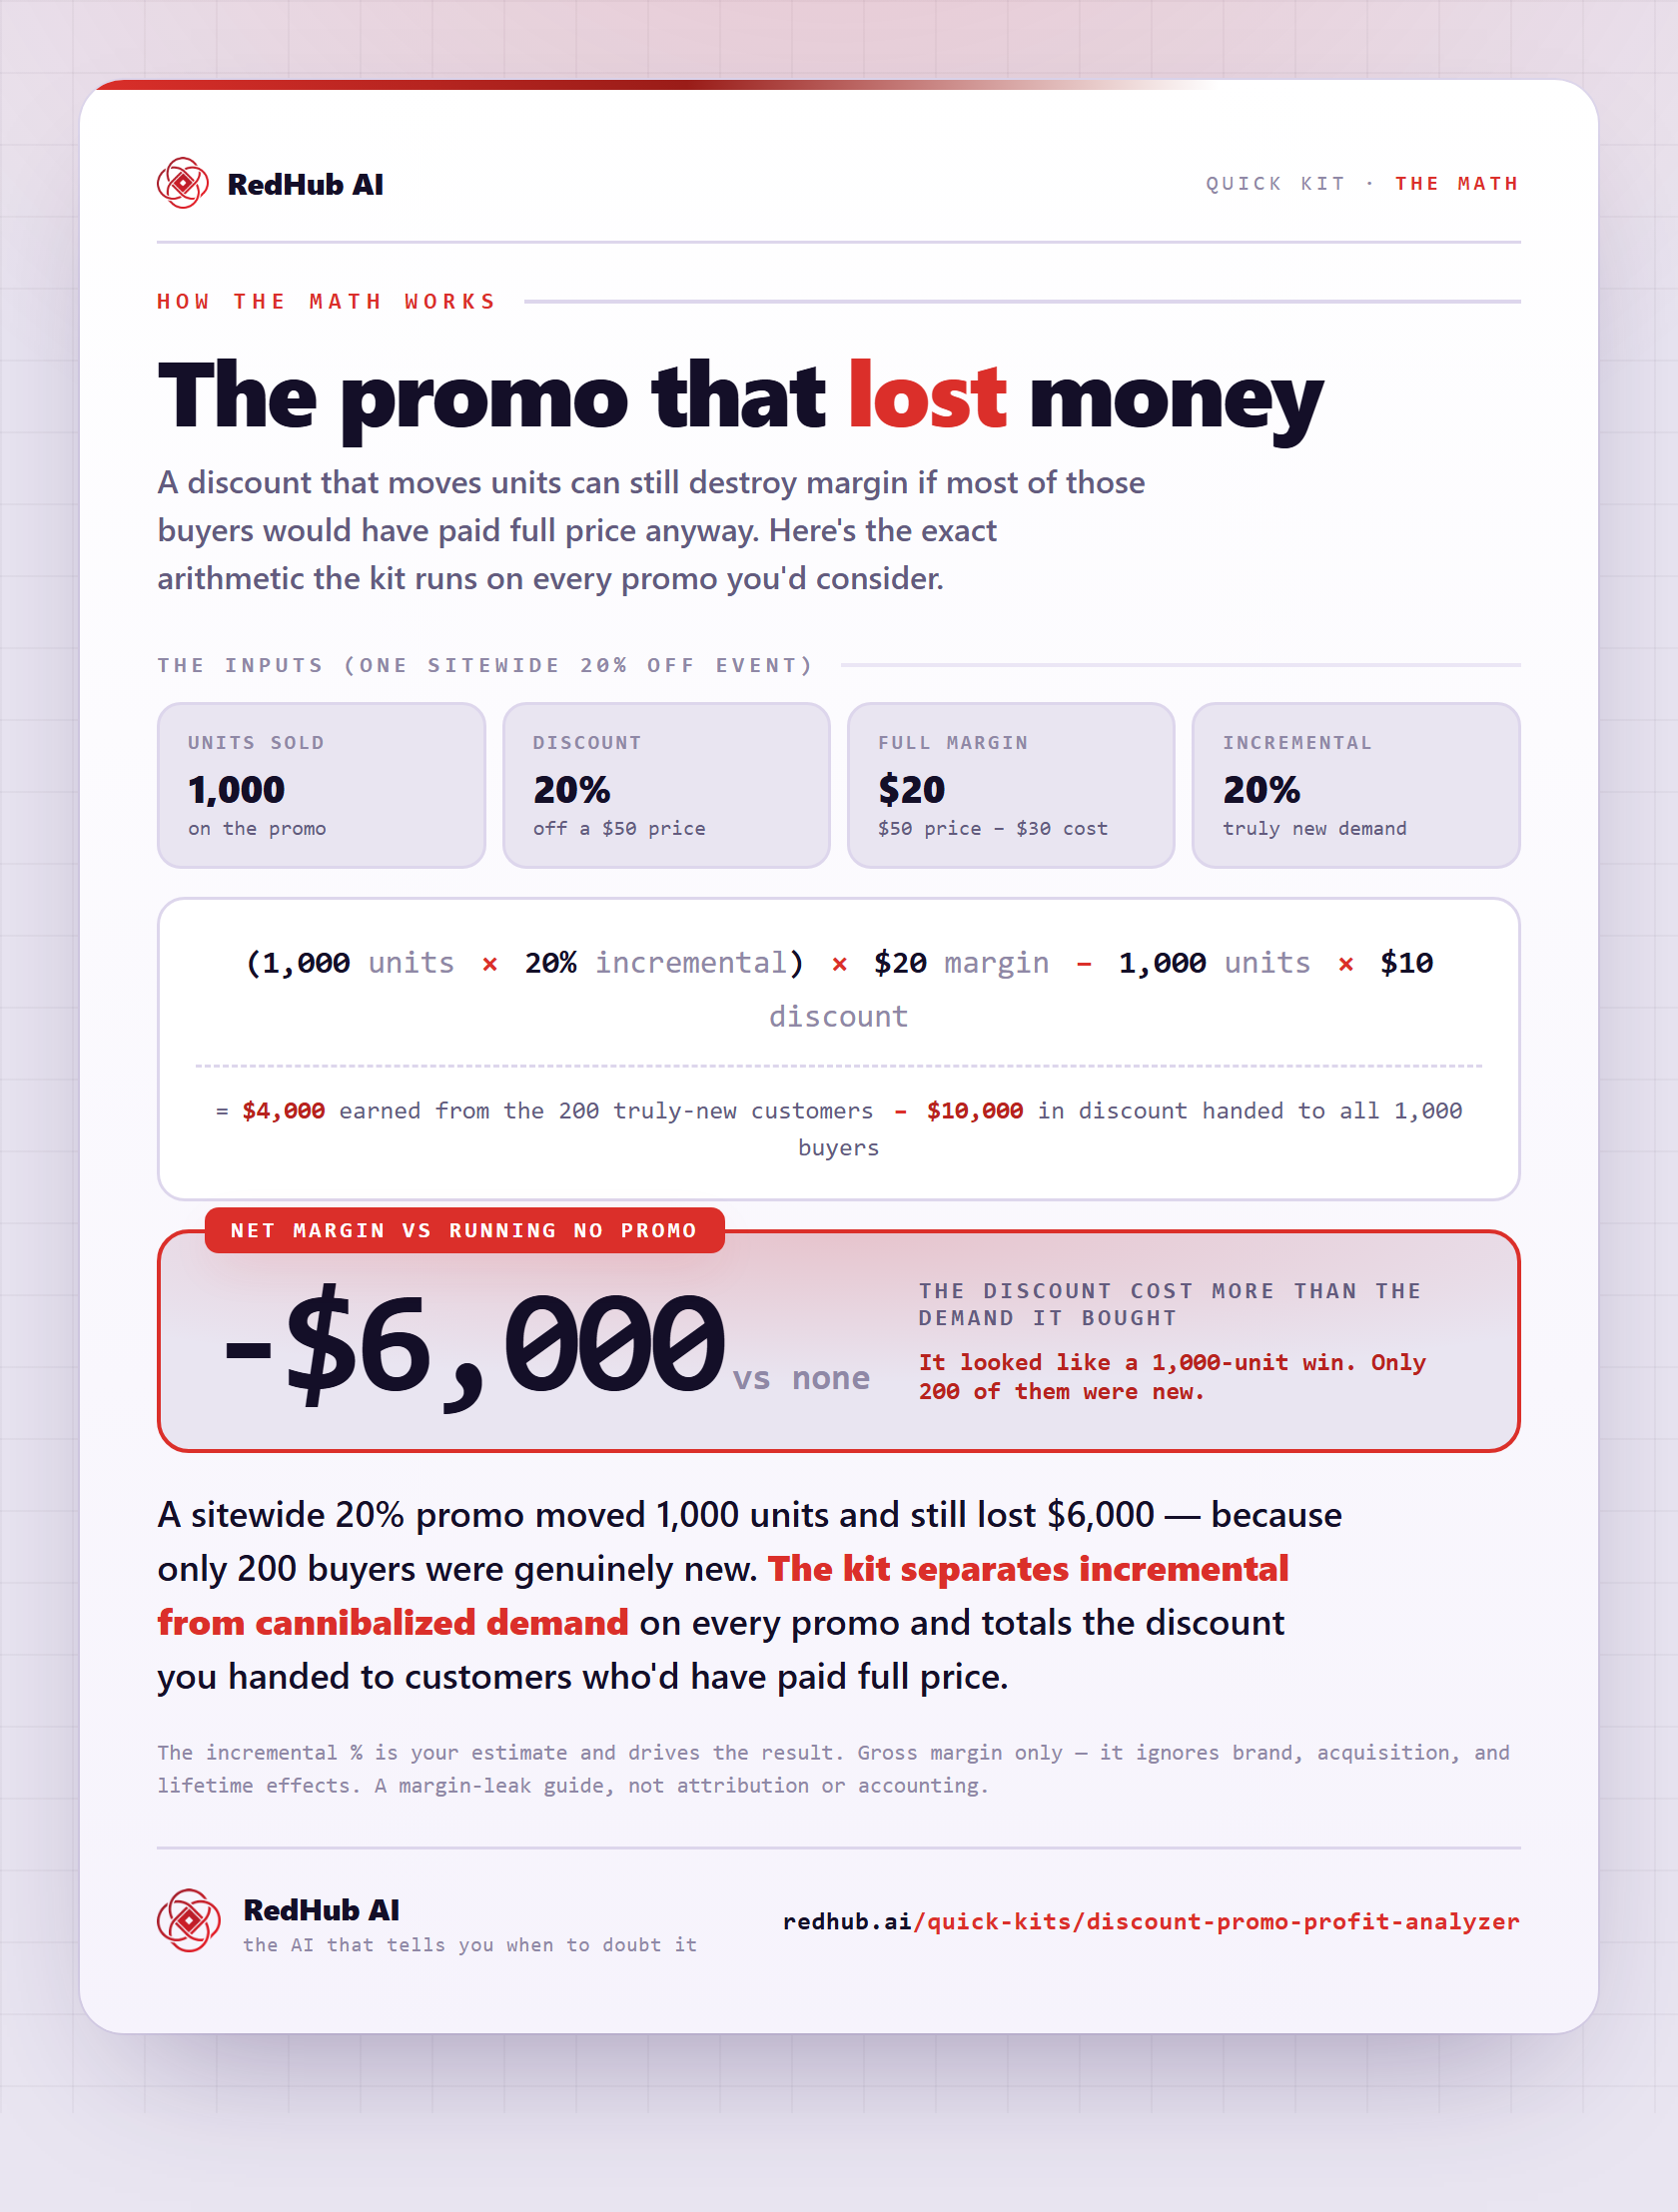
The gate this post refers to, drawn from the tool’s own logic. See the tool.