The Metrics That Tell You a Prompt Is Actually Working
RedHub AI Editorialupdated September 20, 20265 min read

Jump to a section8
A prompt is working when it clears the specific metric thresholds you set for its task — accuracy or F1 for classification, a rubric score or hallucination-rate ceiling for open-ended generation, cost-per-1K-evals and latency percentiles for anything running at real volume — not when it “reads well” in a quick spot check. This guide lists the metrics worth tracking by task type, why cost and latency belong right next to quality instead of being an afterthought, and why no single leaderboard number can tell you whether your prompt actually works.
TL;DR: The metrics that matter depend on the task — accuracy/F1 for classification, rubric or hallucination-rate for generation, and cost-per-1K-evals plus p50/p95 latency for anything running in production. Track them over time, not just once. The Prompt Evaluation & Versioning System ($49) surfaces all of these together in one dashboard. Also see how to evaluate prompts, LLM output scoring, and prompt versioning.
“It reads well” is not a metric
A prompt can produce fluent, confident, well-formatted output that’s also wrong, expensive, or slow enough to hurt the product. Fluency is the easiest thing for a model to get right and the least useful thing to measure, because it doesn’t correlate with whether the output is actually correct for your task. The metrics below are the ones worth tracking instead — they answer whether the prompt is doing its job, not whether it sounds like it is.
Quality metrics by task type
| Task type | Metric | What it catches |
|---|---|---|
| Classification / intent detection | Accuracy, F1 (weighted for imbalanced classes) | Whether the label is right, and whether performance holds up on rarer categories |
| Extraction | Field-level precision/recall | Whether each individual field is correct, not just the overall record |
| Generation / summarization | Rubric score, hallucination flags | Whether the output is fabricating facts not present in the source |
| Tool-use | Pass/fail on correct tool + arguments | Whether the model took the right action, not just wrote plausible text |
Hallucination flags deserve their own line even outside a dedicated generation task — a classifier or extractor can still fabricate a value with no basis in the input, and that failure mode won’t show up in an accuracy number if the golden set doesn’t specifically test for it.
Cost-per-1K-evals is a metric, not an afterthought
A prompt that scores well but costs three times more per call than a slightly-lower-scoring alternative is not automatically the right choice — it depends on your margins and your volume. Track cost-per-1K-evals next to quality every time you benchmark a prompt or a model candidate, so a migration decision weighs both instead of chasing the highest score regardless of what it costs to run at your actual traffic.
Latency percentiles, not averages
An average latency number hides the tail. A prompt with a fine p50 (median) latency can still have a p95 that’s multiples slower — and the p95 is the request your slowest, most frustrated users actually experience. Track p50 and p95 separately, and treat a growing gap between them as a warning sign even if the average looks stable.
Track these over time, not just once
A metrics dashboard is only useful if it shows the trend across versions, not a single reading from the last run. The value of tracking accuracy, cost, and latency together over time is catching the slow drift — a model provider’s update that shaves accuracy by a couple of points every quarter, a prompt that’s crept 20% more expensive over six small edits — the kind of change too gradual for any one regression check to flag on its own.
What these metrics don’t cover
These are prompt-level metrics — they score what one prompt call returns. If the prompt sits downstream of a retrieval step, the retrieved content needs its own quality metrics, covered by the RAG Retrieval Grader ($89). And if you need to measure whether a full multi-step agent completed its actual goal — not just whether one prompt call scored well in isolation — that’s trajectory-level measurement, covered by the Agent Reliability Harness ($149).
Pairs well with
The Prompt Evaluation & Versioning System ($49) tracks accuracy, cost-per-1K, and latency percentiles together in one dashboard template, so you're not stitching quality and cost data from separate tools. For retrieval-specific metrics, use the RAG Retrieval Grader ($89). For measuring a full agent trajectory rather than one prompt call, use the Agent Reliability Harness ($149).
More in this guide
What metrics actually tell me if a prompt is working?
It depends on the task — accuracy or F1 for classification, a rubric score or hallucination rate for generation — plus cost-per-1K-evals and latency percentiles for anything running at real volume. Fluent-sounding output isn’t on this list because it doesn’t correlate with correctness.
Why track cost alongside quality?
Because the highest-scoring prompt or model isn’t automatically the right choice if it costs several times more to run at your actual volume. Cost-per-1K-evals belongs in the same comparison as accuracy, not a separate afterthought.
Why does p95 latency matter more than the average?
Average latency hides the tail. A prompt can have a fine median response time while its p95 — the slowest one-in-twenty requests — is multiples slower, and that’s what your most frustrated users actually experience.
How often should I check these metrics?
On every prompt change, and on a running trend over time — not just a single point-in-time reading. Slow drift across many small edits or model updates is the failure mode a one-time check misses.
Do these metrics cover retrieval or a full agent?
No, these are prompt-level. Retrieval quality needs its own metrics, covered by the RAG Retrieval Grader ($89), and a full agent trajectory needs the Agent Reliability Harness ($149).
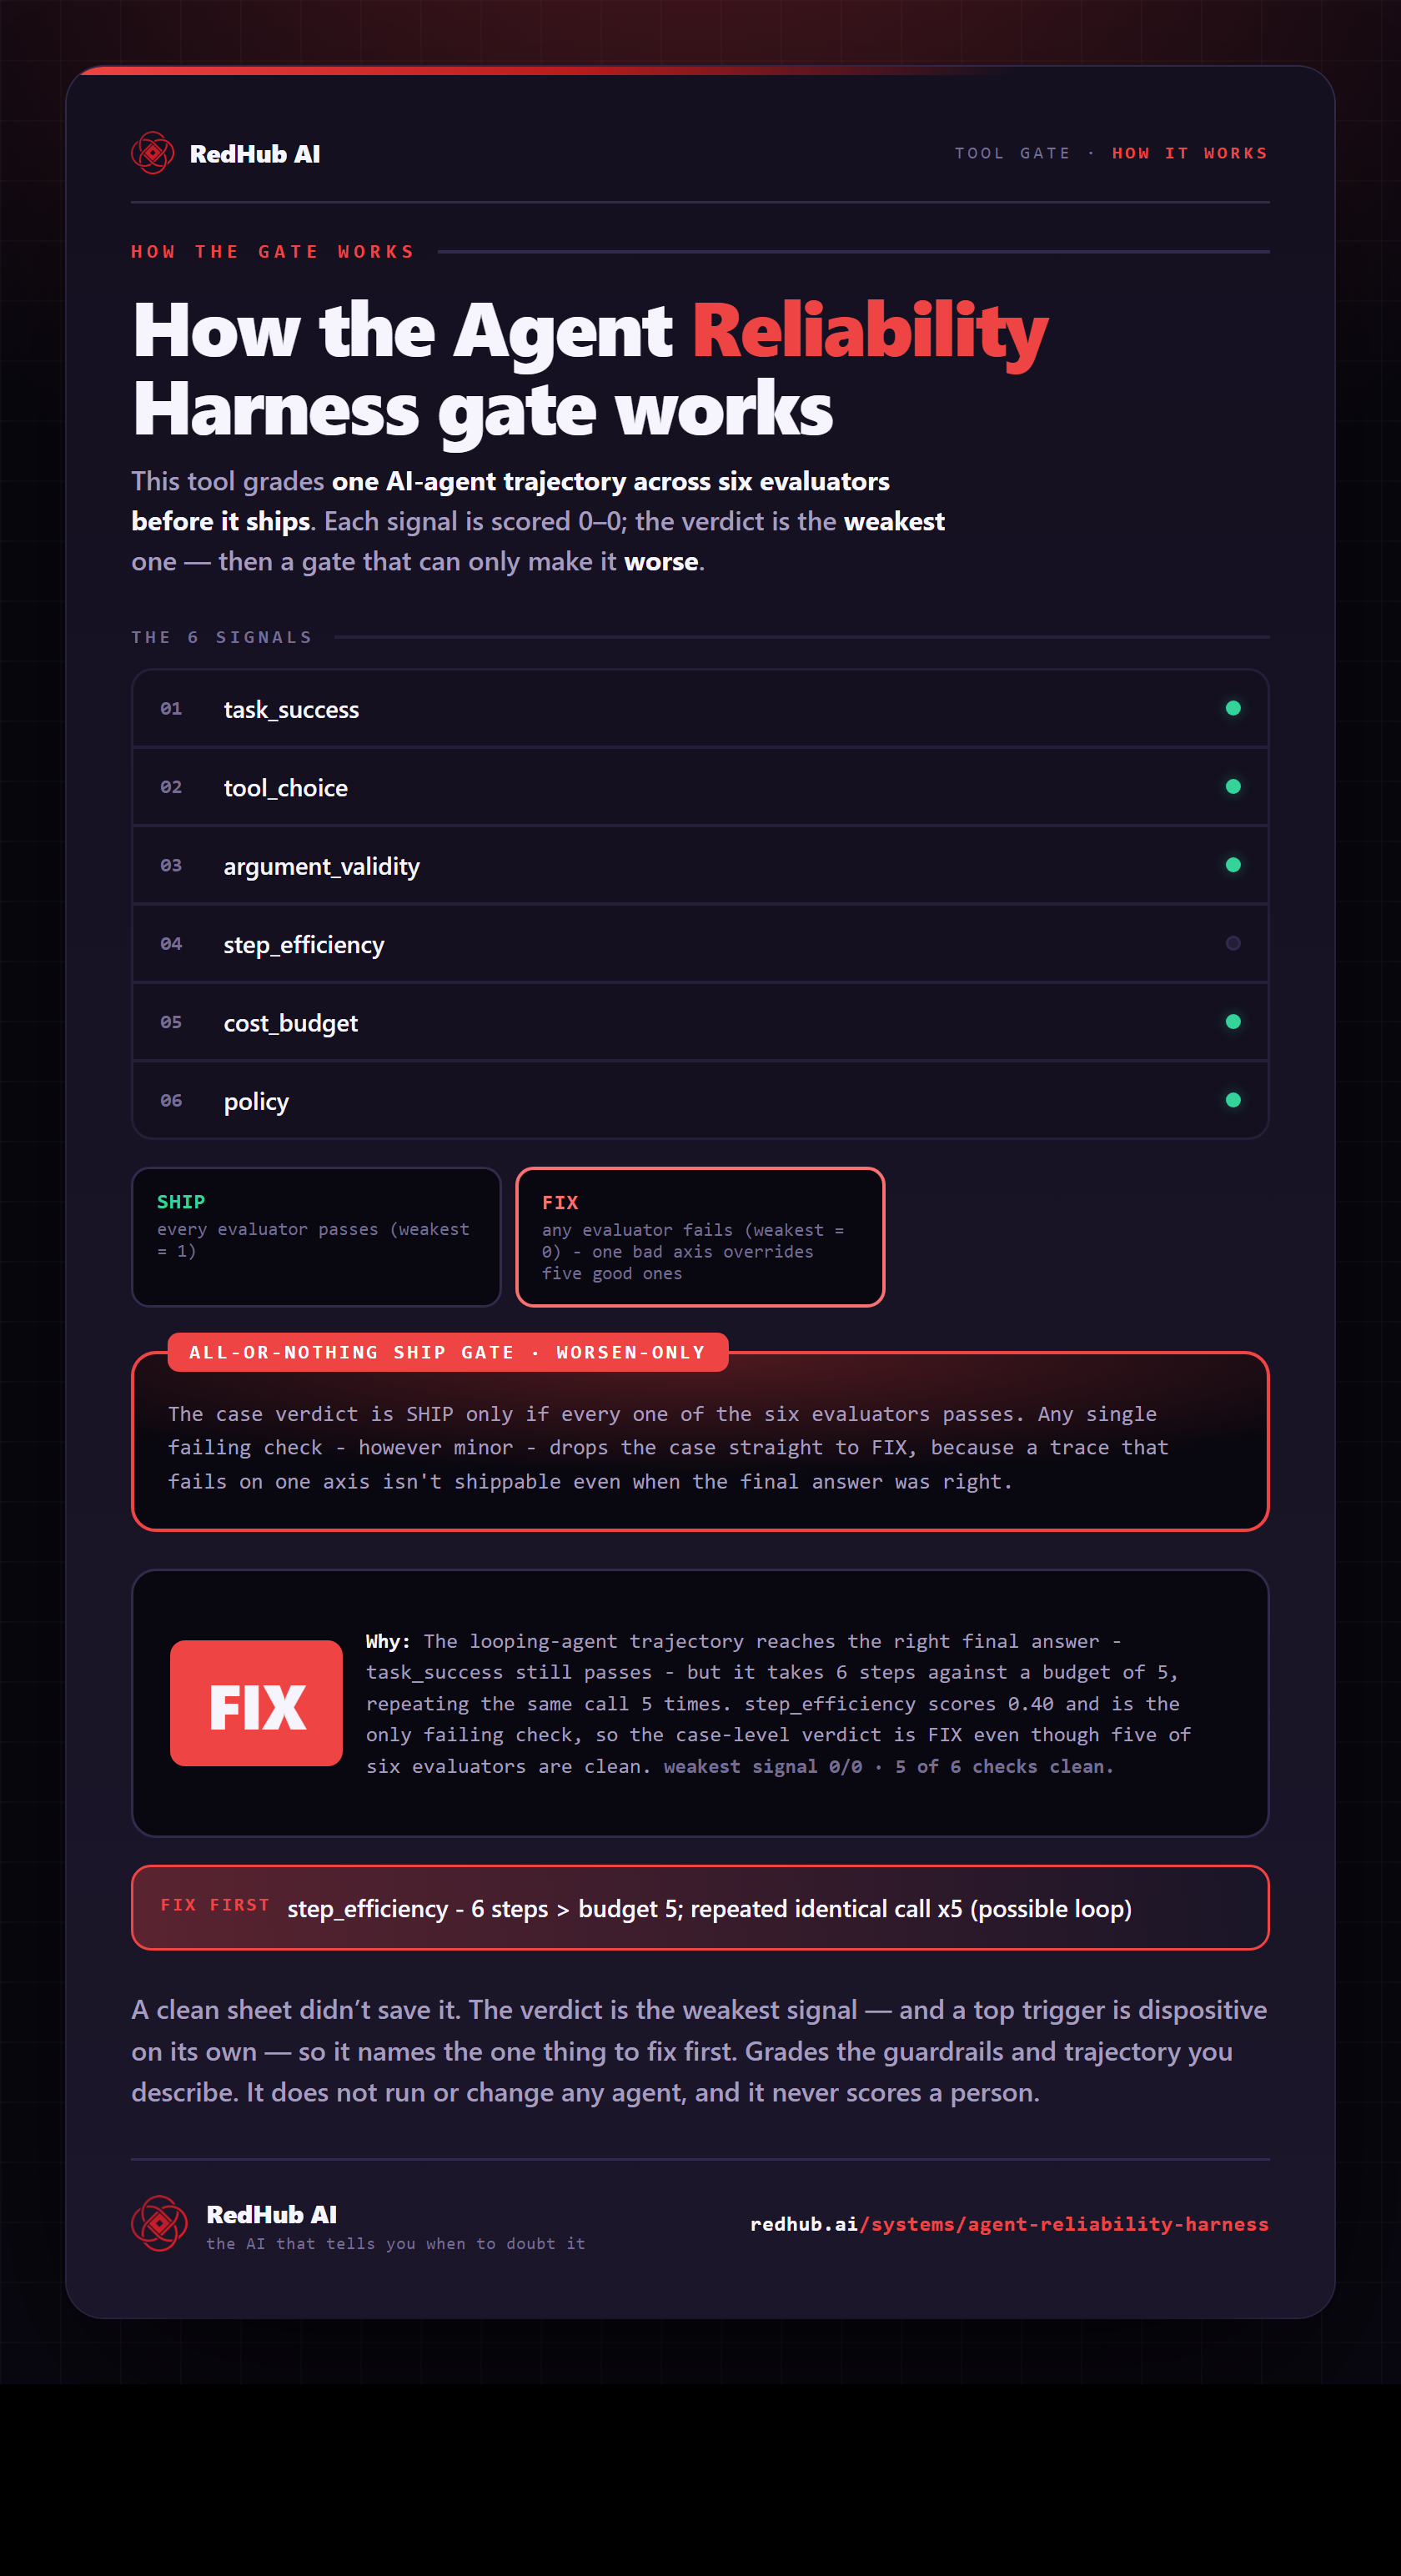
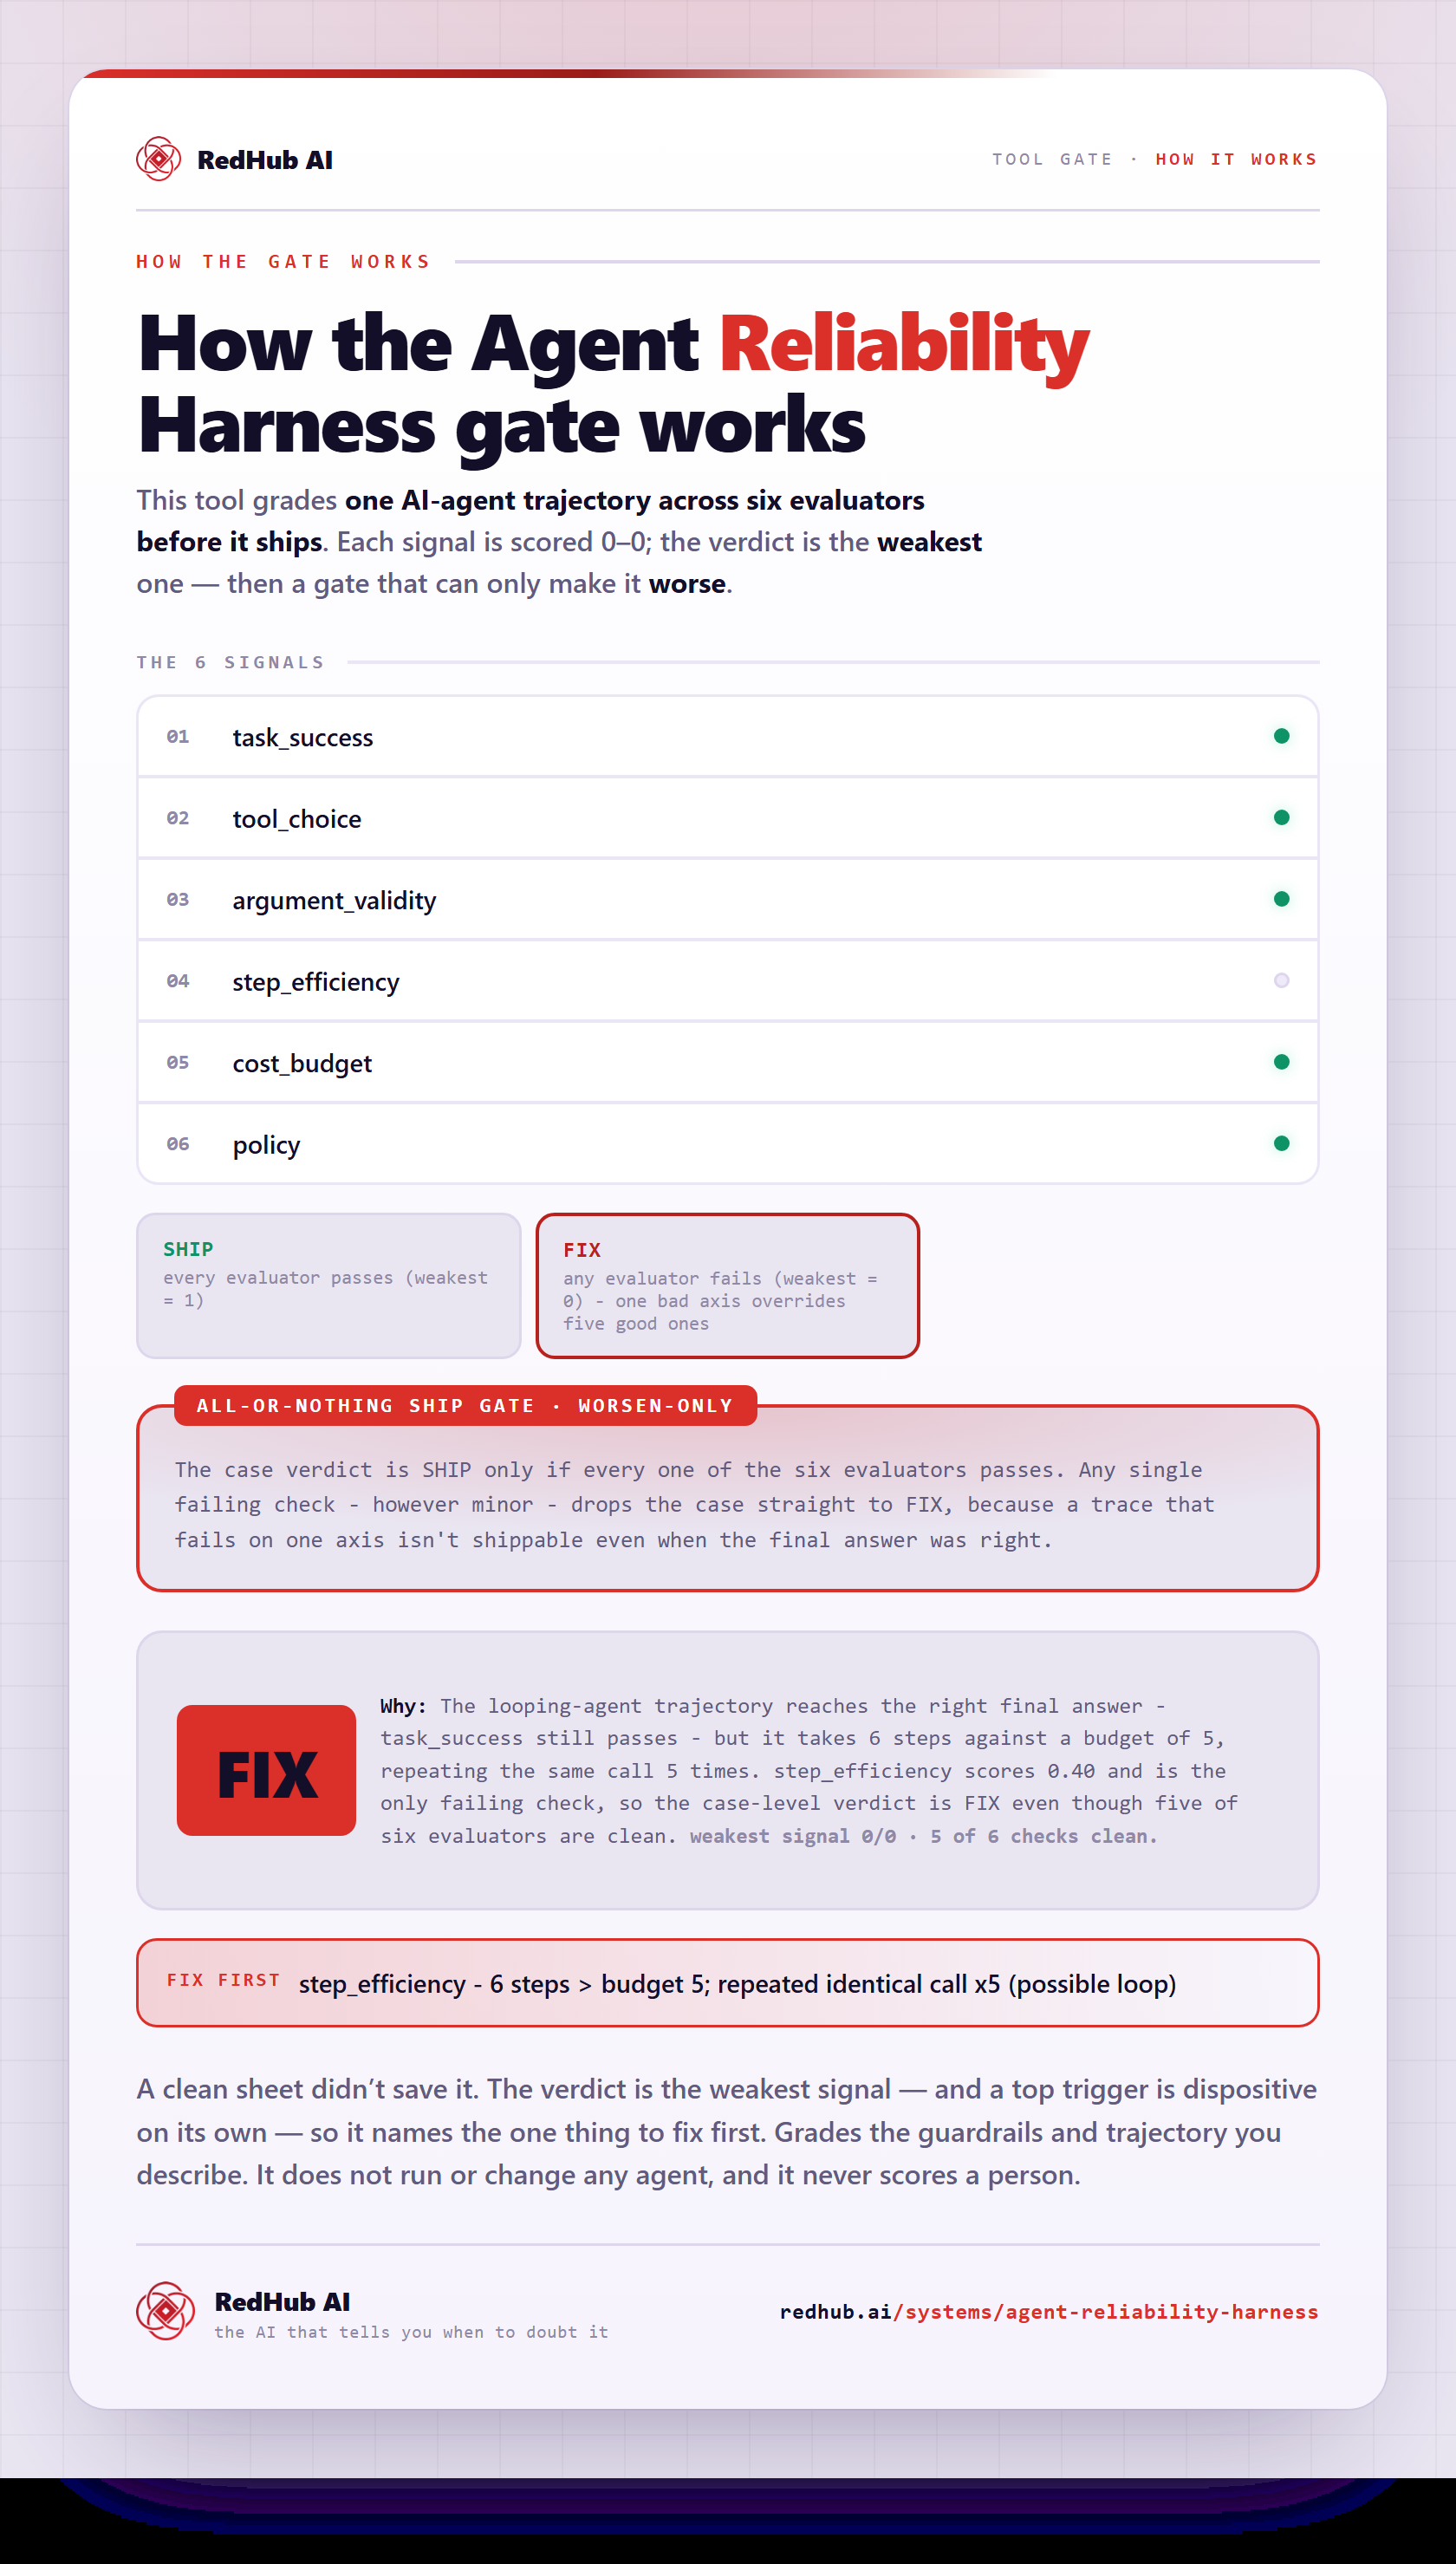
The gate this post refers to, drawn from the tool’s own logic. See the tool.