AI for Data Analysis: What It's Good At and Where It Quietly Lies
RedHub AI Editorialupdated October 5, 20265 min read

Jump to a section9
Whether you can trust AI for data analysis depends on the job you give it. Profiling a dataset, spotting patterns and drafting a summary are jobs it does well. Estimated arithmetic, small-sample judgment and keeping correlation apart from causation are jobs where it slips, and it reports both kinds of result in the same confident tone. Sort the task first, then decide how much checking the answer needs.
TL;DR: AI is strong at profiling data, spotting patterns and drafting summaries. It is weak at estimated calculations, small-sample judgment and staying honest about correlation versus causation. Match each task to the column it belongs in, verify everything in the weak column, and read the reason behind any confidence label rather than the label itself. The AI Data Analysis Starter Kit ($79) is built around that split.
Task by task: where it helps and where it lies
| Task | AI is good at this | Where it quietly lies |
|---|---|---|
| Profiling a new dataset | Fast column typing, missing-value scans, obvious outliers | Can miss subtler data-quality problems unless a prompt tells it to look for them |
| Calculating totals, averages, rates | Real results when it runs code on an uploaded file and shows the work | Estimates when it reads the table as text, and even code can sum the wrong rows |
| Spotting trends | Surfaces patterns faster than manual scanning | Rarely volunteers the sample size a trend rests on |
| Explaining "why" something happened | Proposes plausible hypotheses worth testing | States correlation as causation if you don't stop it |
| Summarizing findings | Turns a table into a readable narrative fast | The tone doesn't separate verified facts from guesses |
| Comparing small segments | Runs the comparison instantly | Treats a 6-row segment with the same confidence as a 600-row one unless told not to |
Why the tone never changes
Language models are built to produce fluent text. Nothing in that fluency tracks how certain the underlying math is, so a checked calculation and an estimated one can read identically. The practical response is to stop reading tone as evidence of accuracy and ask for something checkable instead: the method, the row count and a stated confidence level.
Good at: the speed layer
- A structural profile of a dataset before you dig in (our guide to data profiling covers what that pass should report)
- Narrowing forty columns down to the three worth a closer look
- Drafting a readable first summary of what a spreadsheet contains
- Suggesting follow-up questions you had not thought to ask yet
Weak at: the trust layer
- Arithmetic it estimates instead of calculating, and calculations it never shows
- Volunteering sample-size caveats unprompted
- Holding the line between correlation and causation, a slip our post on correlation vs causation walks through
- Flagging its own uncertainty unless explicitly asked
A confidence label is also model output
Asking for confidence levels is the standard fix, and it helps. But the label comes from the same model that wrote the finding. A HIGH printed next to a figure built on 9 rows is no safer than the figure. What makes a label useful is the reason beside it. "HIGH: 1,240 rows, no gaps in the column" is something you can check against the file. A bare "HIGH" is not.
Even a stated reason can be wrong, because a model can give a fluent justification for a label it got wrong. So the label tells you where to look first, and you still have to look. No prompt we know of closes that gap.
How to prompt around the weak column
- Ask for the method behind every number, not just the number.
- Ask for a confidence level, a one-line reason and a row count on every stated trend.
- Forbid causal language unless something beyond the data supports it, such as a controlled test.
- Spot-check a handful of calculations against the raw data before trusting the rest.
The mistake is uniform trust
Most bad AI analysis does not come from using AI at all. It comes from trusting a profiling summary and a calculated growth rate equally, when only the first deserves that trust without a check. Say the model reports 14% growth from a segment of 11 customers. That is a hypothesis about 11 customers, and the table above tells you to treat it that way.
Put the weak column under rules
The AI Data Analysis Starter Kit pastes five honesty rules into every prompt, so each finding comes back with a HIGH, MEDIUM or LOW confidence level and a one-line reason, thin segments are flagged as hypotheses, and correlation stays separate from causation. It needs an assistant that runs code on your uploads, and costs $79 once.
Get the AI Data Analysis Starter Kit — $79Pairs well with
The AI Over-Reliance & Critical-Thinking Check ($69) tests whether you catch errors in AI output, including a fabricated statistic, and returns INDEPENDENT, ASSISTED or RELIANT. The Prompt Practice Lab ($69) drills the habit this post depends on, since a prompt with no request for verification cannot score STRONG. If the analysis sits on a spreadsheet model full of formulas, the Spreadsheet Formula & Model Integrity Auditor ($69) grades each formula cell SOUND, REVIEW or BROKEN before you trust its totals.
More in this guide
Can I trust AI's numbers when it analyzes a spreadsheet for me?
Not by default. Verify calculated figures against the raw data, especially anything computed across many rows. The confident tone does not tell you whether the math was calculated, estimated or checked.
What is AI actually reliable for in data analysis?
Fast structural profiling, pattern-spotting and drafting a readable first summary. Those are jobs where being roughly right, fast, is useful and a mistake is cheap to catch.
What should I never take at face value from an AI data analysis?
A calculated number with no method shown, a trend with no stated sample size, and any claim that one thing "causes" or "drives" another.
Why does AI state correlation as causation so often?
Language models are built to produce fluent text, not to match the strength of a claim to what the data proves. A causal sentence and a correlational one read as equally confident, even though only one is supported.
Can I trust the confidence levels AI gives its own findings?
Treat them as a guide to where to check first, not as proof. A label is only as good as the reason next to it, so ask for a one-line reason and a row count with every label and check those against your file.
What does the AI Data Analysis Starter Kit do differently?
It writes the weak-column checks into the prompts: compute on the actual data, a HIGH, MEDIUM or LOW confidence level with a reason on every finding, small-sample flags, and correlation kept separate from causation. $79, one-time.
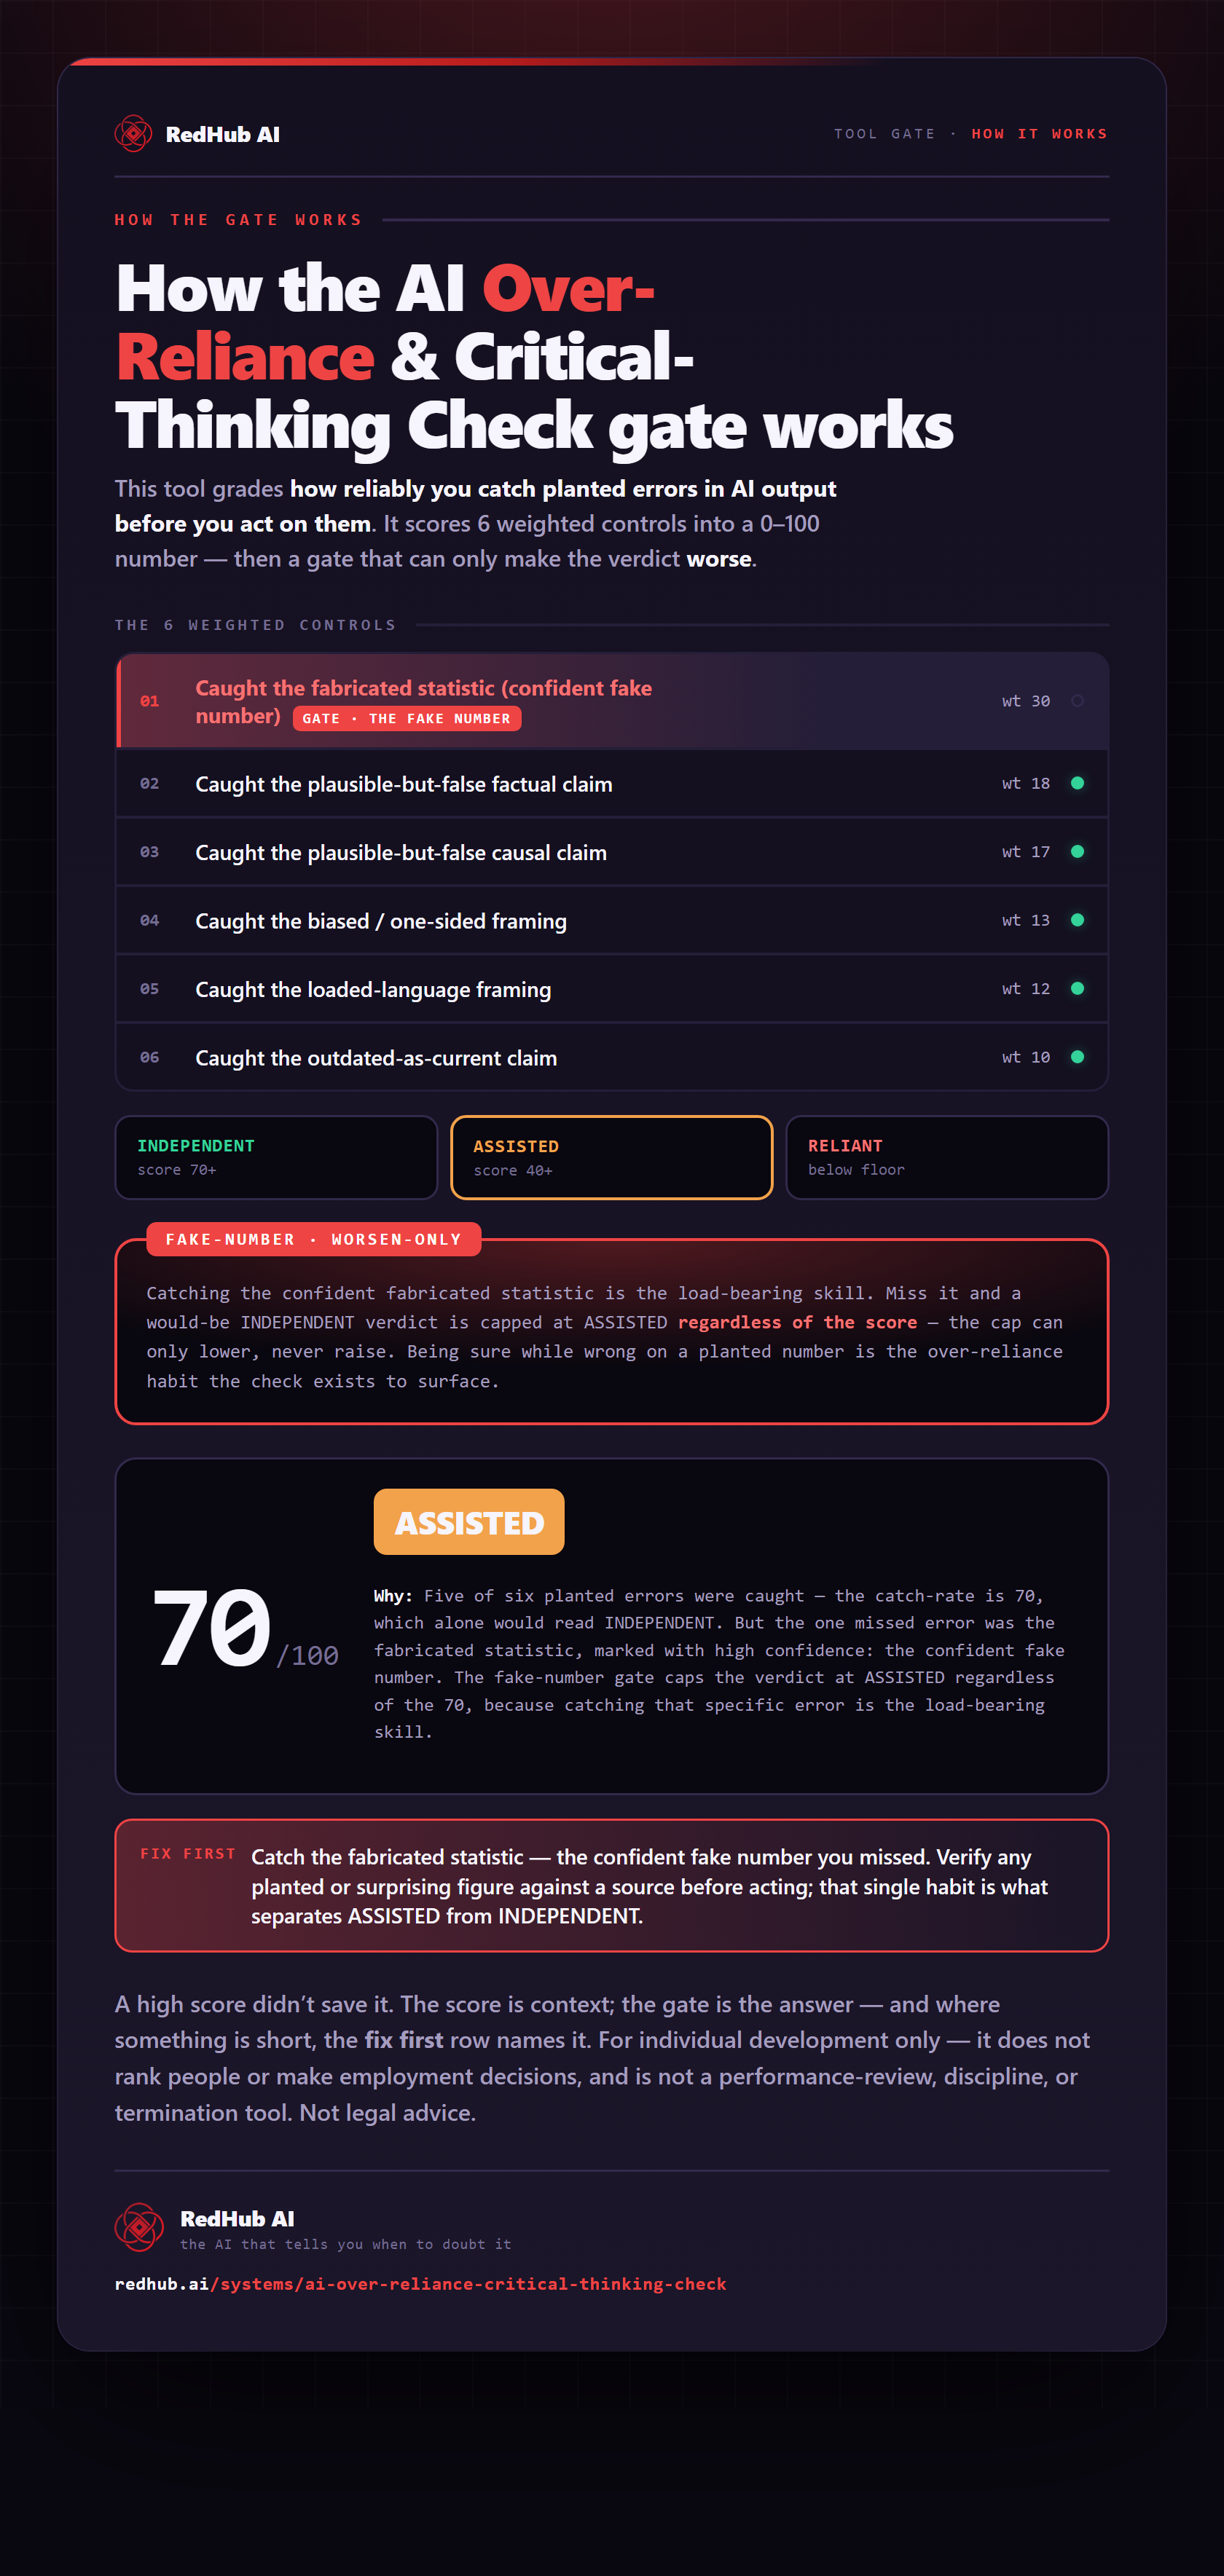
The gate this post refers to, drawn from the tool’s own logic. See the tool.