Cart Abandonment: Why Shoppers Leave and How to Fix It
RedHub AI Editorialupdated October 4, 20265 min read
Jump to a section6
About seven in ten online shopping carts never become orders. Baymard Institute (opens in a new tab) averages 50 published studies of cart abandonment and arrives at 70.22% of carts abandoned. That one number hides two groups of shoppers. The first was never going to buy that day: they were comparing prices, saving items for later or just looking. The second wanted to buy and hit a problem at checkout, most often an extra cost they did not expect. No checkout change will win over the first group. The second group left for reasons you can find, and you can remove those reasons one at a time.
TL;DR: Baymard Institute's average across 50 studies puts cart abandonment at 70.22%. A large part is browsing: in Baymard's survey, 42% of US online shoppers have abandoned a cart because they were just browsing. Set that aside and extra costs lead the reasons at 40%. Track your own rate, find the one driver hurting your checkout most, and fix it first. The Checkout Friction & Abandonment Exposure Gate ($79) grades a flow you describe and, where a signal is short, names the one to fix first. Deep dives: checkout friction, reducing abandonment, the top drivers and a checkout checklist.
What the 70% figure can and cannot tell you
Baymard's number is widely quoted, and it earns that. The list is public, it names every source, and Baymard keeps it updated. Read the list, though. The 50 studies run from 55.00% at the low end (Forrester Research, 2010) to 84.27% at the high end (SaleCycle, 2020), and only 8 of them date from 2020 or later. They also measure different things: different industries, different devices, and different ideas of when a cart counts as abandoned.
So the average tells you the problem is large and normal. It cannot tell you whether your checkout is getting worse.
Browsing is real, and it is not your problem
People use carts as wish lists, price trackers and gift shortlists. Baymard's survey of US online shoppers found 42% have abandoned a cart because they were "just browsing / not ready to buy." A faster form will not convert someone who never meant to pay today, and a store that treats every abandoned cart as a lost sale ends up chasing the wrong people.
The hard part is that your reports cannot separate the two groups. A cart left by a price-checker and a cart left by a buyer who saw a $12 shipping line at the last step look identical in an abandoned-cart report. Where in the flow people leave gives you a hint. It does not give you an answer, and no dashboard will.
The documented drivers, ranked
Set the browsers aside and Baymard's survey gives a ranked list of what stopped the rest. These are the top six:
| Reason shoppers gave | Share (Baymard, browsing set aside) |
|---|---|
| Extra costs too high (shipping, tax, fees) | 40% |
| Delivery was too slow | 20% |
| Didn't trust the site with card details | 19% |
| The site wanted me to create an account | 18% |
| Too long or complicated checkout | 17% |
| Website had errors or crashed | 17% |
Extra costs lead by a wide margin, at double the next reason. Each line is something the store controls: the price display, the delivery promise, the payment page, the signup rule, the form and the code. The full list, including returns policies and declined cards, is in why customers abandon checkout.
Fix the worst driver first
A checkout with surprise shipping will not be saved by a new payment button. A checkout that forces signup will not be saved by trimming one field. Working through ten best practices at once leaves the one doing the damage in place, and when the rate does move, you cannot say which change moved it.
The order that works is narrower. Find the worst driver, fix it, measure again, then take the next one. The worst signal outweighs the average. Take Main store checkout, one of five flows in the Gate's worked sample: 2 out of 2 on six of seven signals, 1 on total-cost transparency, and still a HEMORRHAGING verdict, because a partial failure on that one signal is enough. Start with the friction concept in checkout friction, then work the fixes in how to reduce cart abandonment.
Find the driver costing your checkout the most
Describe each checkout flow you run, and the Checkout Friction & Abandonment Exposure Gate scores it on seven friction signals, from total-cost transparency to delivery clarity, and returns SMOOTH, LEAKING or HEMORRHAGING, with the signal to fix first where one is short. A partial failure on total-cost transparency or guest checkout forces HEMORRHAGING on its own. It is deterministic and offline: it connects to no store, processes no payments and guarantees no conversion rate.
Get the Checkout Friction & Abandonment Exposure Gate — $79Pairs well with
Some shoppers will leave a good checkout anyway. The Cart-Recovery Sequence Effectiveness Gate ($49) grades the email flow that follows them on seven levers and returns OPTIMIZED, UNDERPERFORMING or DORMANT. Before the cart, the AI Offer & Landing-Page Conversion Kit ($79) works on the offer and landing page, with a claim-honesty linter that returns Launch, Tune or Rework. After the sale, the Returns & Refund Profit Analyzer ($39) shows true profit per SKU once returns come back, with a keep, fix or drop verdict.
More in this guide
What is cart abandonment?
Cart abandonment is when a shopper adds items to an online cart and leaves without placing the order. The cart abandonment rate is the share of carts that never become orders over a given period.
What is the average cart abandonment rate?
Baymard Institute's average of 50 published studies is 70.22%. The individual studies range from 55.00% to 84.27% and define abandonment in different ways, so use the average as a sense of scale and track your own rate over time.
Why do shoppers abandon their carts?
In Baymard's survey of US online shoppers, 42% have abandoned a cart because they were just browsing. Among the other reasons, extra costs lead at 40%, followed by slow delivery at 20%, not trusting the site with card details at 19% and being made to create an account at 18%.
Can a store get cart abandonment to zero?
No. Browsing, price comparison and saving items for later will always leave carts behind. The part a store can work on is the checkout friction that stops shoppers who meant to buy.
Should I fix every checkout best practice at once?
No. Find the single driver hurting your flow the most, fix it and measure again. Changing everything at once leaves you unable to tell which change helped, and a surprise-shipping problem is not solved by adding a payment option.
Does the Checkout Friction Gate connect to my store?
No. You describe each checkout flow by scoring seven signals, and it returns SMOOTH, LEAKING or HEMORRHAGING offline, with the signal to fix first where one is short. It reads nothing live, processes no payments and promises no conversion or recovery rate.
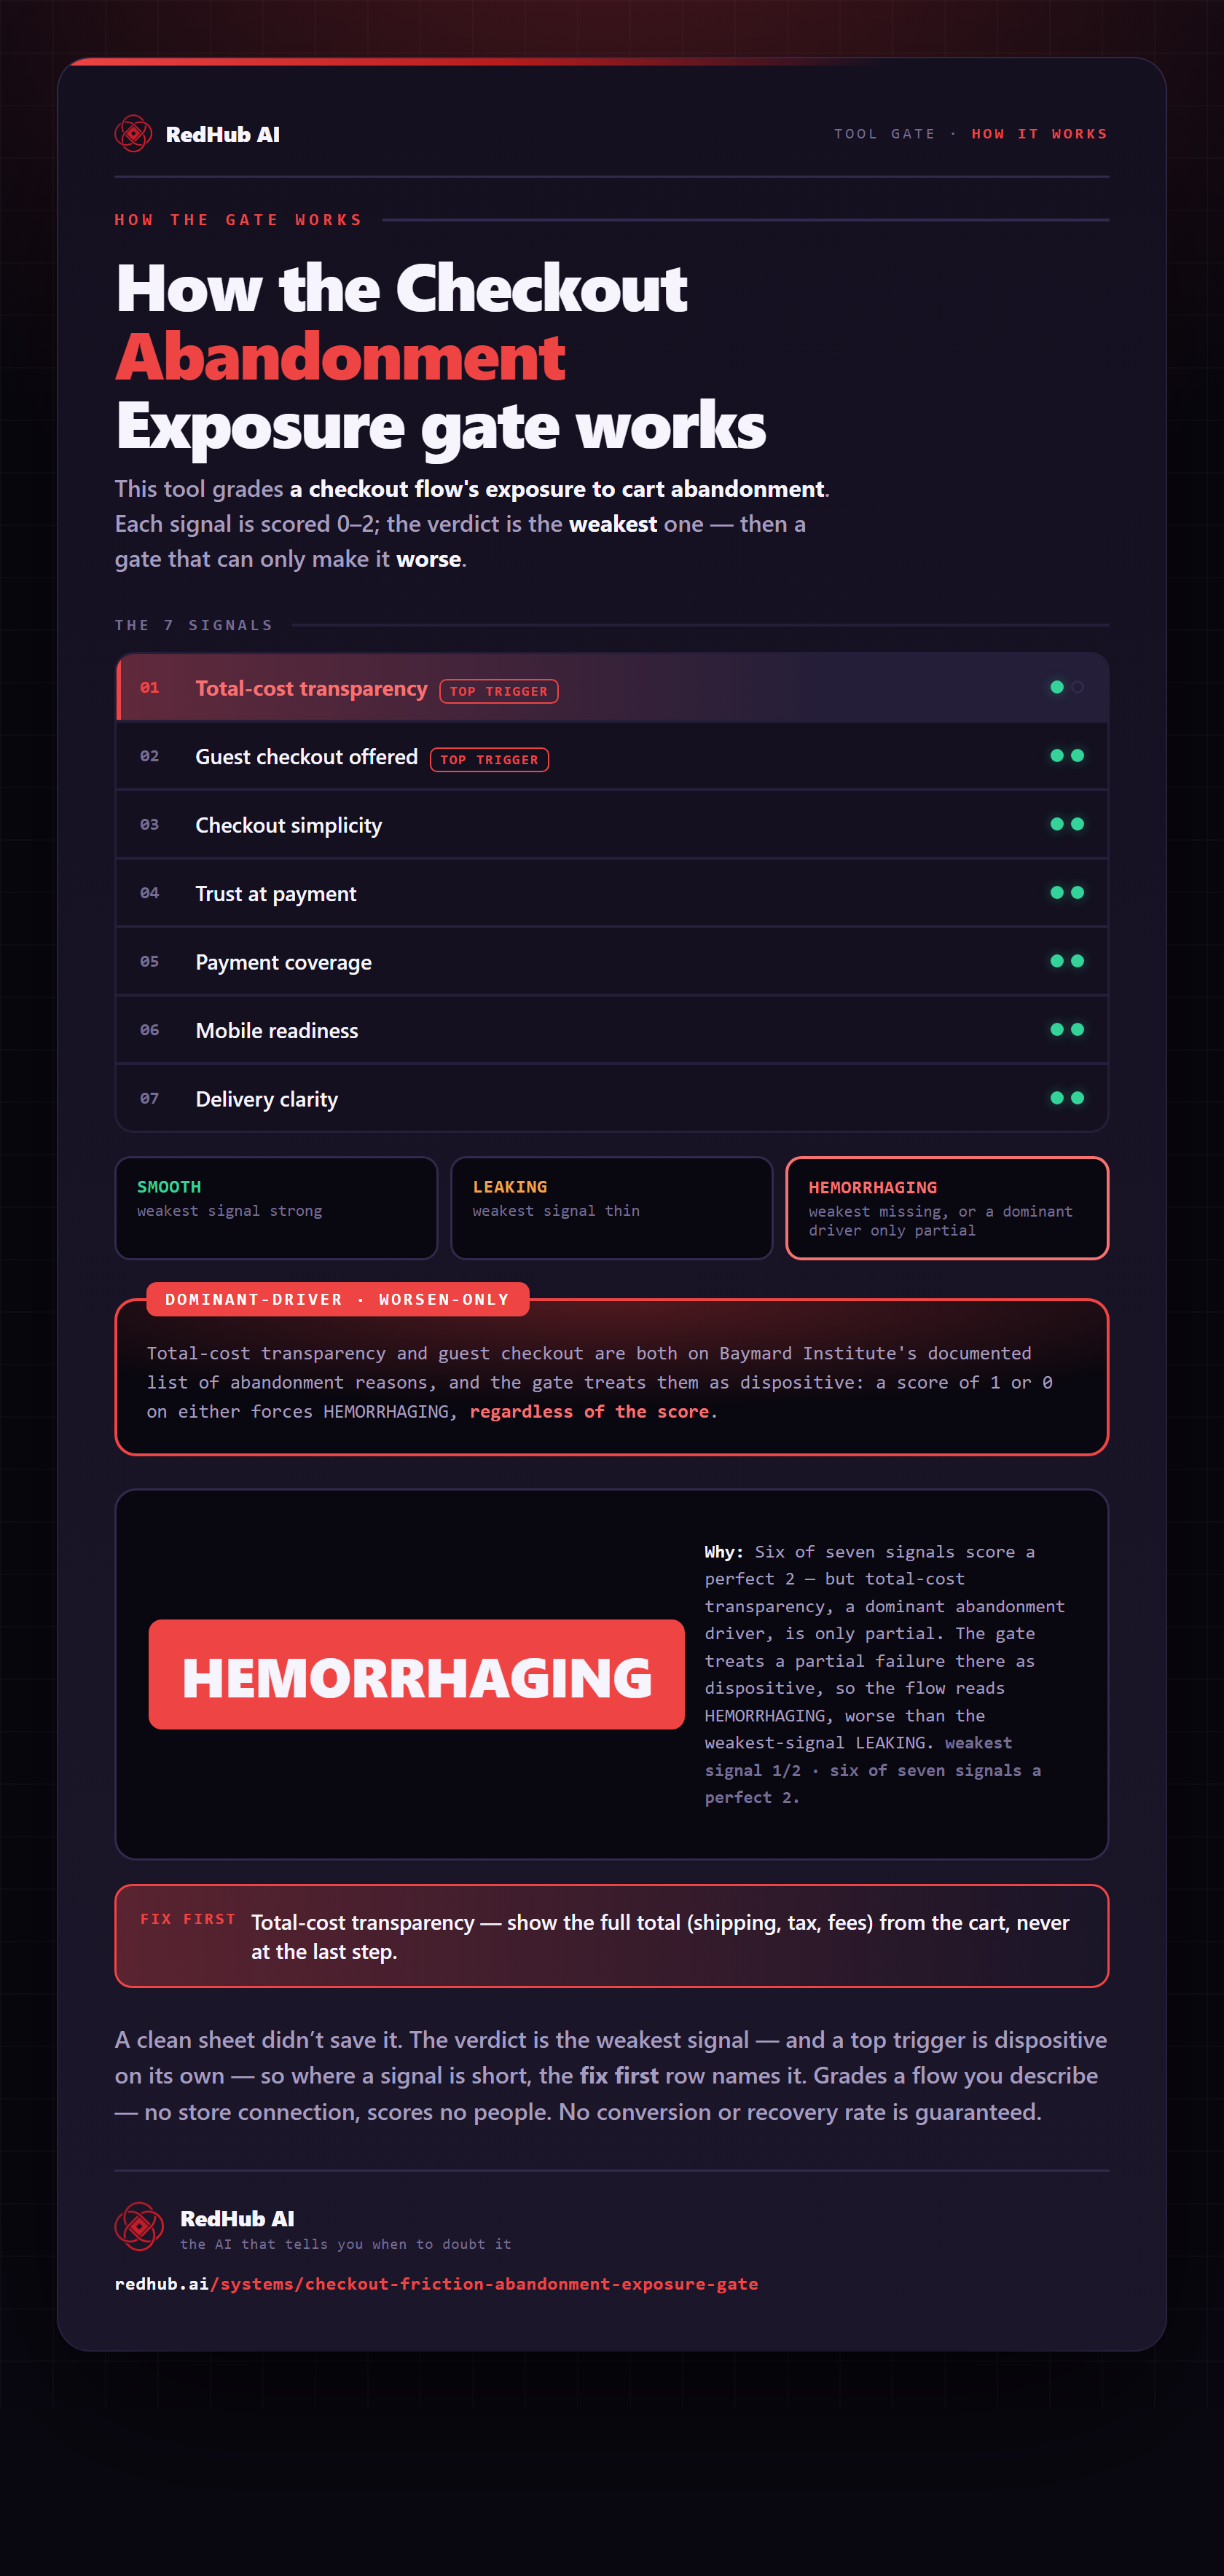
The gate this post refers to, drawn from the tool’s own logic. See the tool.