Why Customers Abandon Checkout: The Top Drivers
RedHub AI Editorialupdated October 4, 20265 min read

Jump to a section6
Ask why customers abandon checkout and the most common answer is money they did not expect to pay. In Baymard Institute's (opens in a new tab) survey of US online shoppers, with the "just browsing" answer set aside, 40% named extra costs such as shipping, tax and fees. Slow delivery came second at 20%, ahead of distrust of the site with card details at 19% and being made to create an account at 18%. Every reason on the list is something a store can change. Which one is costing you depends on your checkout, not the survey.
TL;DR: Extra costs top the reasons at 40% in Baymard Institute's survey, followed by slow delivery (20%), not trusting the site with card details (19%), forced account creation (18%), a long or complicated checkout (17%) and site errors (17%). Separately, 42% of shoppers have abandoned a cart because they were just browsing. Survey answers show what is common, not what is happening in your store. Match the list to your own flow, then fix the worst driver. The Checkout Friction & Abandonment Exposure Gate ($79) scores your flow against these drivers. Part of the guide on cart abandonment.
The full list, with the numbers
Baymard first separates the 42% of US online shoppers who have abandoned a cart because they were "just browsing / not ready to buy." For everyone else, it reports these reasons:
| Reason | Share | What the store controls |
|---|---|---|
| Extra costs too high (shipping, tax, fees) | 40% | Price display, shipping pricing |
| Delivery was too slow | 20% | Delivery options, how dates are shown |
| Didn't trust the site with card details | 19% | The payment page |
| The site wanted me to create an account | 18% | Guest checkout |
| Too long or complicated checkout | 17% | Steps and fields |
| Website had errors or crashed | 17% | Testing and site performance |
| Returns policy wasn't satisfactory | 13% | The returns policy and where it shows |
| Couldn't see or calculate the total up front | 12% | When costs appear |
| The credit card was declined | 10% | Payment setup, error messages |
| There weren't enough payment methods | 9% | Payment coverage |
The figures add up to well over 100%, so many shoppers gave more than one reason. Read the rows as overlapping causes, not slices of one pie.
The driver most checklists skip: delivery
Slow delivery is the second-biggest reason on the list, and it is not about the checkout form at all. A shopper who wanted the item by Friday and cannot tell when it will arrive has a good reason to stop. Vague text such as "ships in 3 to 7 business days" leaves them to guess.
The holiday season makes this sharper, and the honest fix is information. Show an estimated delivery date early in the flow, not only on the last screen. Once your carriers publish their holiday shipping deadlines, show your last order date for holiday delivery as a plain fact. A countdown timer that resets is fake urgency. A published date is information.
What a survey can and cannot tell you
These are answers people gave about past purchases they abandoned. They are useful because they are consistent, and limited because they are recalled. A shopper who left because the form felt endless may remember the shipping fee they saw on the way out. A survey tells you what shoppers say. Your step-by-step drop-off tells you where they actually left, and the two do not always agree.
From the list to your fix
Knowing the list is step one. Matching it to your checkout is step two. Walk your flow against each driver and ask honestly whether it is present, or use a structured diagnostic. Marketplace guest flow, from the Gate's worked sample, shows how that plays out. Its costs are clear and guest checkout is on, but it scores 0 on checkout simplicity, so it reads HEMORRHAGING, and checkout simplicity is the fix to make first. Then apply the fixes in how to reduce cart abandonment.
Turn the general list into your priority
Each of the Checkout Friction & Abandonment Exposure Gate's seven signals tracks a driver on this list, from total-cost transparency and guest checkout to payment coverage and delivery clarity. Describe a flow, and it returns SMOOTH, LEAKING or HEMORRHAGING and, where a signal is short, the one to fix first. Deterministic and offline: it finds the cause, and you make the fix.
Get the Checkout Friction & Abandonment Exposure Gate — $79Pairs well with
The AI Offer & Landing-Page Conversion Kit ($79) works on the page that sends shoppers to the cart, with a claim linter that returns Launch, Tune or Rework. If the fix for the returns-policy row would cost real margin, the Returns & Refund Profit Analyzer ($39) shows true profit per SKU after returns, with a keep, fix or drop verdict. The Cart-Recovery Sequence Effectiveness Gate ($49) grades the email flow that follows shoppers who leave, on seven levers.
More in this guide
What are the top reasons customers abandon checkout?
In Baymard Institute's survey of US online shoppers, with just-browsing set aside: extra costs (40%), slow delivery (20%), not trusting the site with card details (19%), forced account creation (18%), a long or complicated checkout (17%) and site errors or crashes (17%).
What is the number-one cause?
Extra costs such as shipping, tax and fees, cited by 40% in Baymard's survey, twice the next reason. Showing the full total in the cart, or folding costs into the price, removes the last-step surprise.
Does delivery speed affect checkout abandonment?
Yes. In Baymard's survey, 20% abandoned because delivery was too slow, the second most common reason. Showing an estimated delivery date early in the flow helps shoppers decide before they reach the payment step.
Isn't some abandonment just window-shopping?
Yes. Baymard found 42% of US online shoppers have abandoned a cart because they were just browsing. That share is largely outside a store's control. Focus on the shoppers who wanted to buy and were stopped by a fixable driver.
Do the same drivers apply to every store?
The list of possible drivers is consistent, but which one hurts you varies. A store with clear free shipping has no surprise-cost problem, however often extra costs top the survey. Check your own flow against the list.
Are these drivers actually fixable?
Each one is a change the store controls: cost display, delivery information, the payment page, guest checkout, form length, site stability, returns policy and payment options. None of them require persuading the shopper; they remove the reason a willing buyer stopped.
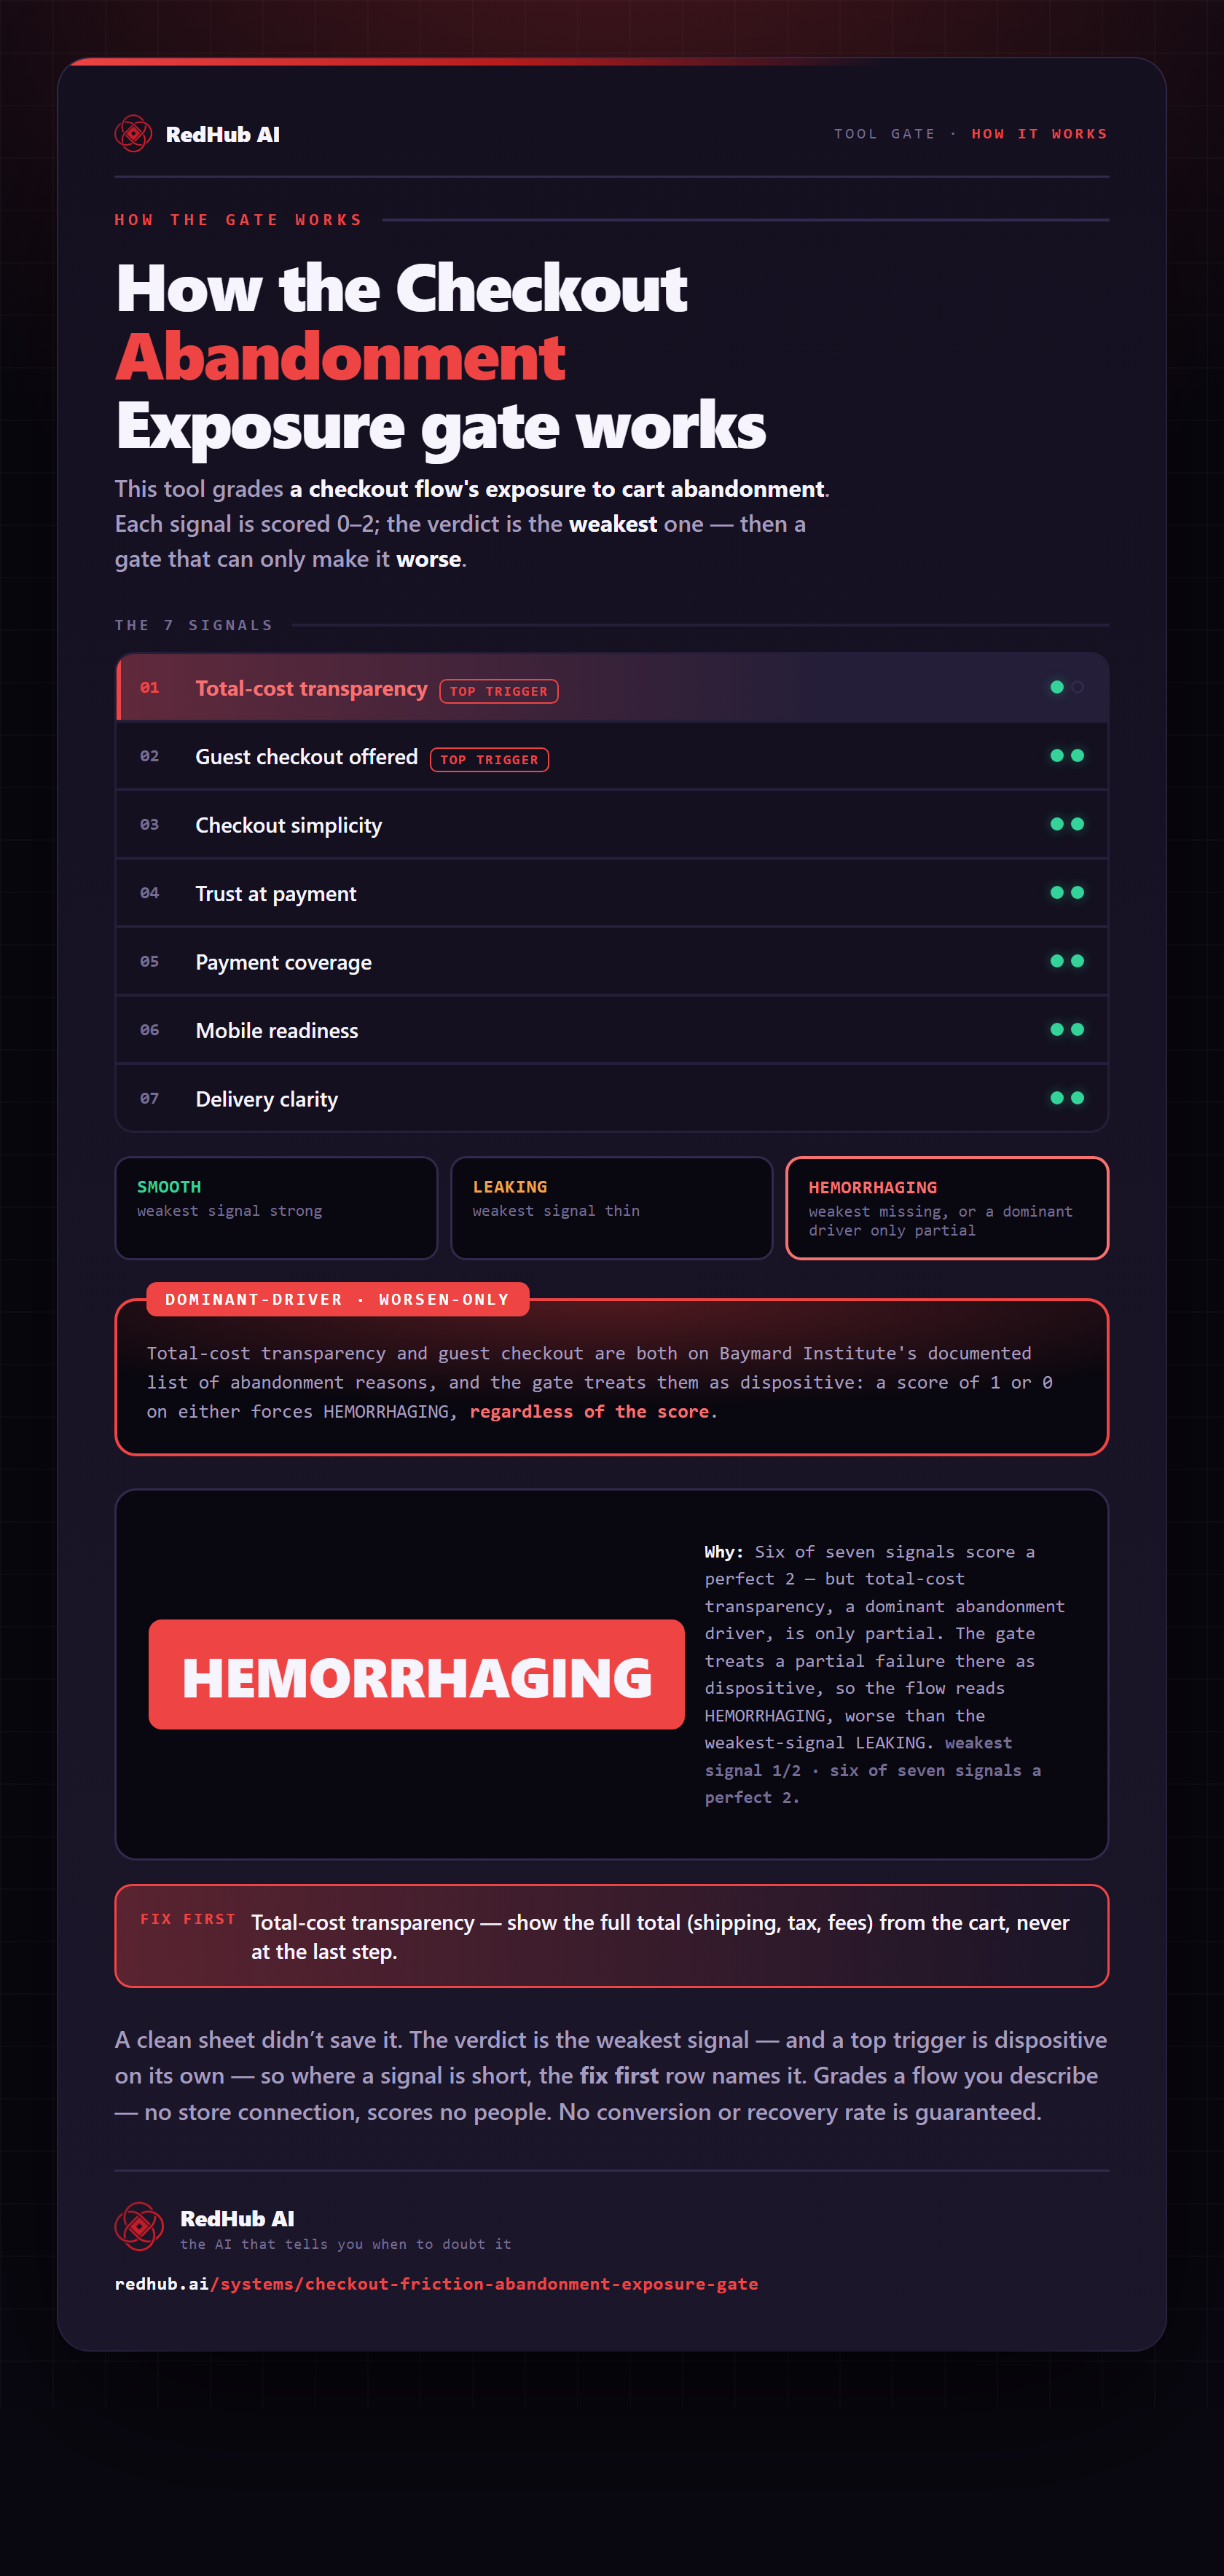
The gate this post refers to, drawn from the tool’s own logic. See the tool.