How to Calculate Your Own Cart Recovery Rate
RedHub AI Editorialupdated November 5, 20267 min read

Jump to a section7
Your cart recovery rate is the share of abandoned carts that turn into orders after your recovery flow chases them, over a fixed window. The formula is recovered carts divided by abandoned carts, in the same window, times 100. The math is easy. The hard part is that the number depends on two definitions you choose, and that is why we will not give you an industry figure to compare it with.
TL;DR: Pick a window, define “abandoned” and “recovered,” then divide recovered by abandoned. Hold those definitions fixed so this quarter compares with last quarter. Do not compare with a published average: window length, attribution rules and traffic mix differ by store, so a borrowed number can mislead in either direction. To price a gap, one point of recovery rate is worth monthly abandoned carts times average order value, divided by 100.
The formula, with your own numbers
Two definitions come before any division. They are also the reason one store’s number cannot be laid next to another’s.
- Pick a window. Choose a fixed period, such as 30 days, and use it for both halves of the formula. Your number: the window length you will keep using, so each period compares with the last.
- Define “abandoned.” Decide when a cart counts as abandoned. Platforms differ on when they log one, so read how yours does it. Your number: your platform’s abandoned-cart count for the window.
- Define “recovered.” Decide what counts as a recovery: a purchase within a set number of days of the abandon, and whether it must come from a recovery message. Your number: the count of carts that meet your definition in the same window.
- Divide. Recovered carts ÷ abandoned carts × 100. Your number: your cart recovery rate for that window, tied to the definitions above.
| Input | What you need | Where to find it |
|---|---|---|
| Window | A fixed period, such as 30 days | Your own choice, held constant |
| Abandoned carts | Your count for the window | Your store or email platform’s abandonment report |
| Recovered carts | Your count, same window | Your platform’s attributed-recovery report, under your rule |
| Recovery rate | Recovered ÷ abandoned × 100 | Calculated from the two rows above |
What each half of the formula moves with
Call your abandoned carts for the window A and your recovered carts R. The rate is R ÷ A × 100. The two halves move for different reasons.
A is a volume number. It rises with traffic and product mix, and an ad campaign can lift it without your flow changing at all. R is the number your recovery flow actually works on, through depth, timing and the other levers in this guide. So track R by itself as well as the rate. If A and R grow at the same pace, the rate holds still while the flow is recovering more orders than before.
| Definition of “recovered” | Effect on your number |
|---|---|
| Strict: only purchases clicked from a recovery email | Lower rate, and every counted recovery traces to the flow |
| Loose: any purchase in the window, any channel | Higher rate, but some of it may be shoppers who would have come back anyway |
Pick one and hold it. Switch from loose to strict halfway through the year and your rate drops though the flow did not get worse. You would read a measurement change as a performance change.
Why we will not hand you an industry number
This post has not given you a target percentage, and it will not. A published average cart recovery rate is built from other stores’ windows, other definitions of “recovered,” other attribution rules and other product mixes. It also blends stores running a full sequence with stores sending one email, and you cannot tell which one you are being compared with.
A borrowed number misleads in two directions. If your rate sits above it, you may stop looking for the gaps the other posts in this guide cover. If your rate sits below it, you may chase a gap that comes from a different business model or a different order value, not from your flow.
The Cart-Recovery Sequence Effectiveness Gate follows the same rule. It ships no recovery benchmark. Its Start Here tab puts it plainly: “No baked-in recovery benchmark, no invented lift multiplier.”
Setting a target you control
- Start from your own baseline. The rate you just calculated is the floor. Your number: your baseline rate.
- Tie the target to one change. Adding a second message, fixing a timing gap, or moving a discount out of message one are each a specific change. Your target is a number you pick for that change. Nobody can assign it to you. Your number: the target rate you are willing to test against.
- Recalculate on the same window. Check again after a full window, not after a few days. Your number: the next period’s rate, same definitions.
The revenue math, on your own numbers
Once you have a baseline and a target, you can price the gap between them. The formula is monthly abandoned carts × average order value × (target rate − current rate) ÷ 100. That gives a monthly figure. Multiply by 12 for a year.
The cleanest way to use it is to price one point first. Take a hypothetical store with 3,000 abandoned carts a month and a $60 average order value. One percentage point of recovery rate is worth 3,000 × $60 × 1 ÷ 100 = $1,800 a month, or $21,600 a year. A gap of two points is twice that. This needs no claim about what rate the store should reach. It only says what each point is worth to that store.
| Input | Whose number | Where it comes from |
|---|---|---|
| Monthly abandoned carts | Yours | Your platform’s monthly abandonment count |
| Average order value | Yours | Your own AOV report |
| Current recovery rate | Yours | The formula above |
| Target recovery rate | Yours | The number you chose for one specific change |
Two limits are worth stating. First, the math values every recovered cart at your average order value. If your abandoned carts tend to be larger or smaller than your completed orders, the figure will be off by that difference. Second, it is a planning number, not a forecast. It tells you whether a gap is worth chasing next to your other priorities. It does not tell you what will happen when you make the change.
The Recovery Scorecard tab in the Cart-Recovery Sequence Effectiveness Gate runs exactly this math, per flow, for up to five flows. You type in the four numbers. It does not calculate your current rate for you, and it does not connect to your platform. If the target is blank, or at or below the current rate, it shows no upside. The Dashboard adds up the yearly upside across your flows and labels it “illustrative, not a promise.” It also grades each flow on seven structural levers and, when any lever is short, names the one to fix first.
More in this guide
Frequently asked questions
What is a good cart recovery rate?
We will not give you one. Window length, the definition of a recovery, attribution rules and traffic mix all differ by store, so a published average cannot be compared with your number. Calculate your own baseline and track whether it moves after a specific change.
How do I calculate my cart recovery rate?
Divide recovered carts by abandoned carts in the same fixed window and multiply by 100. Use your own platform’s counts and one definition of a recovery, held constant.
What counts as a recovered cart?
Whatever you define it as, as long as you use the same definition every time. A common choice is a purchase within a set number of days of the abandon, either clicked from a recovery email or from any channel.
How much is one point of cart recovery rate worth?
Monthly abandoned carts times average order value, divided by 100, per month. A hypothetical store with 3,000 abandoned carts a month and a $60 average order value gets $1,800 a month per point, or $21,600 a year.
How often should I recalculate my recovery rate?
Once per full window, using the same window and definitions as your baseline. Checking every few days tends to produce noise rather than a real change.
Does the Cart-Recovery Sequence Effectiveness Gate calculate my recovery rate?
No. You enter your current rate and a target rate yourself, along with monthly abandoned carts and average order value. Its optional revenue panel then prices the gap per flow, with no built-in benchmark.
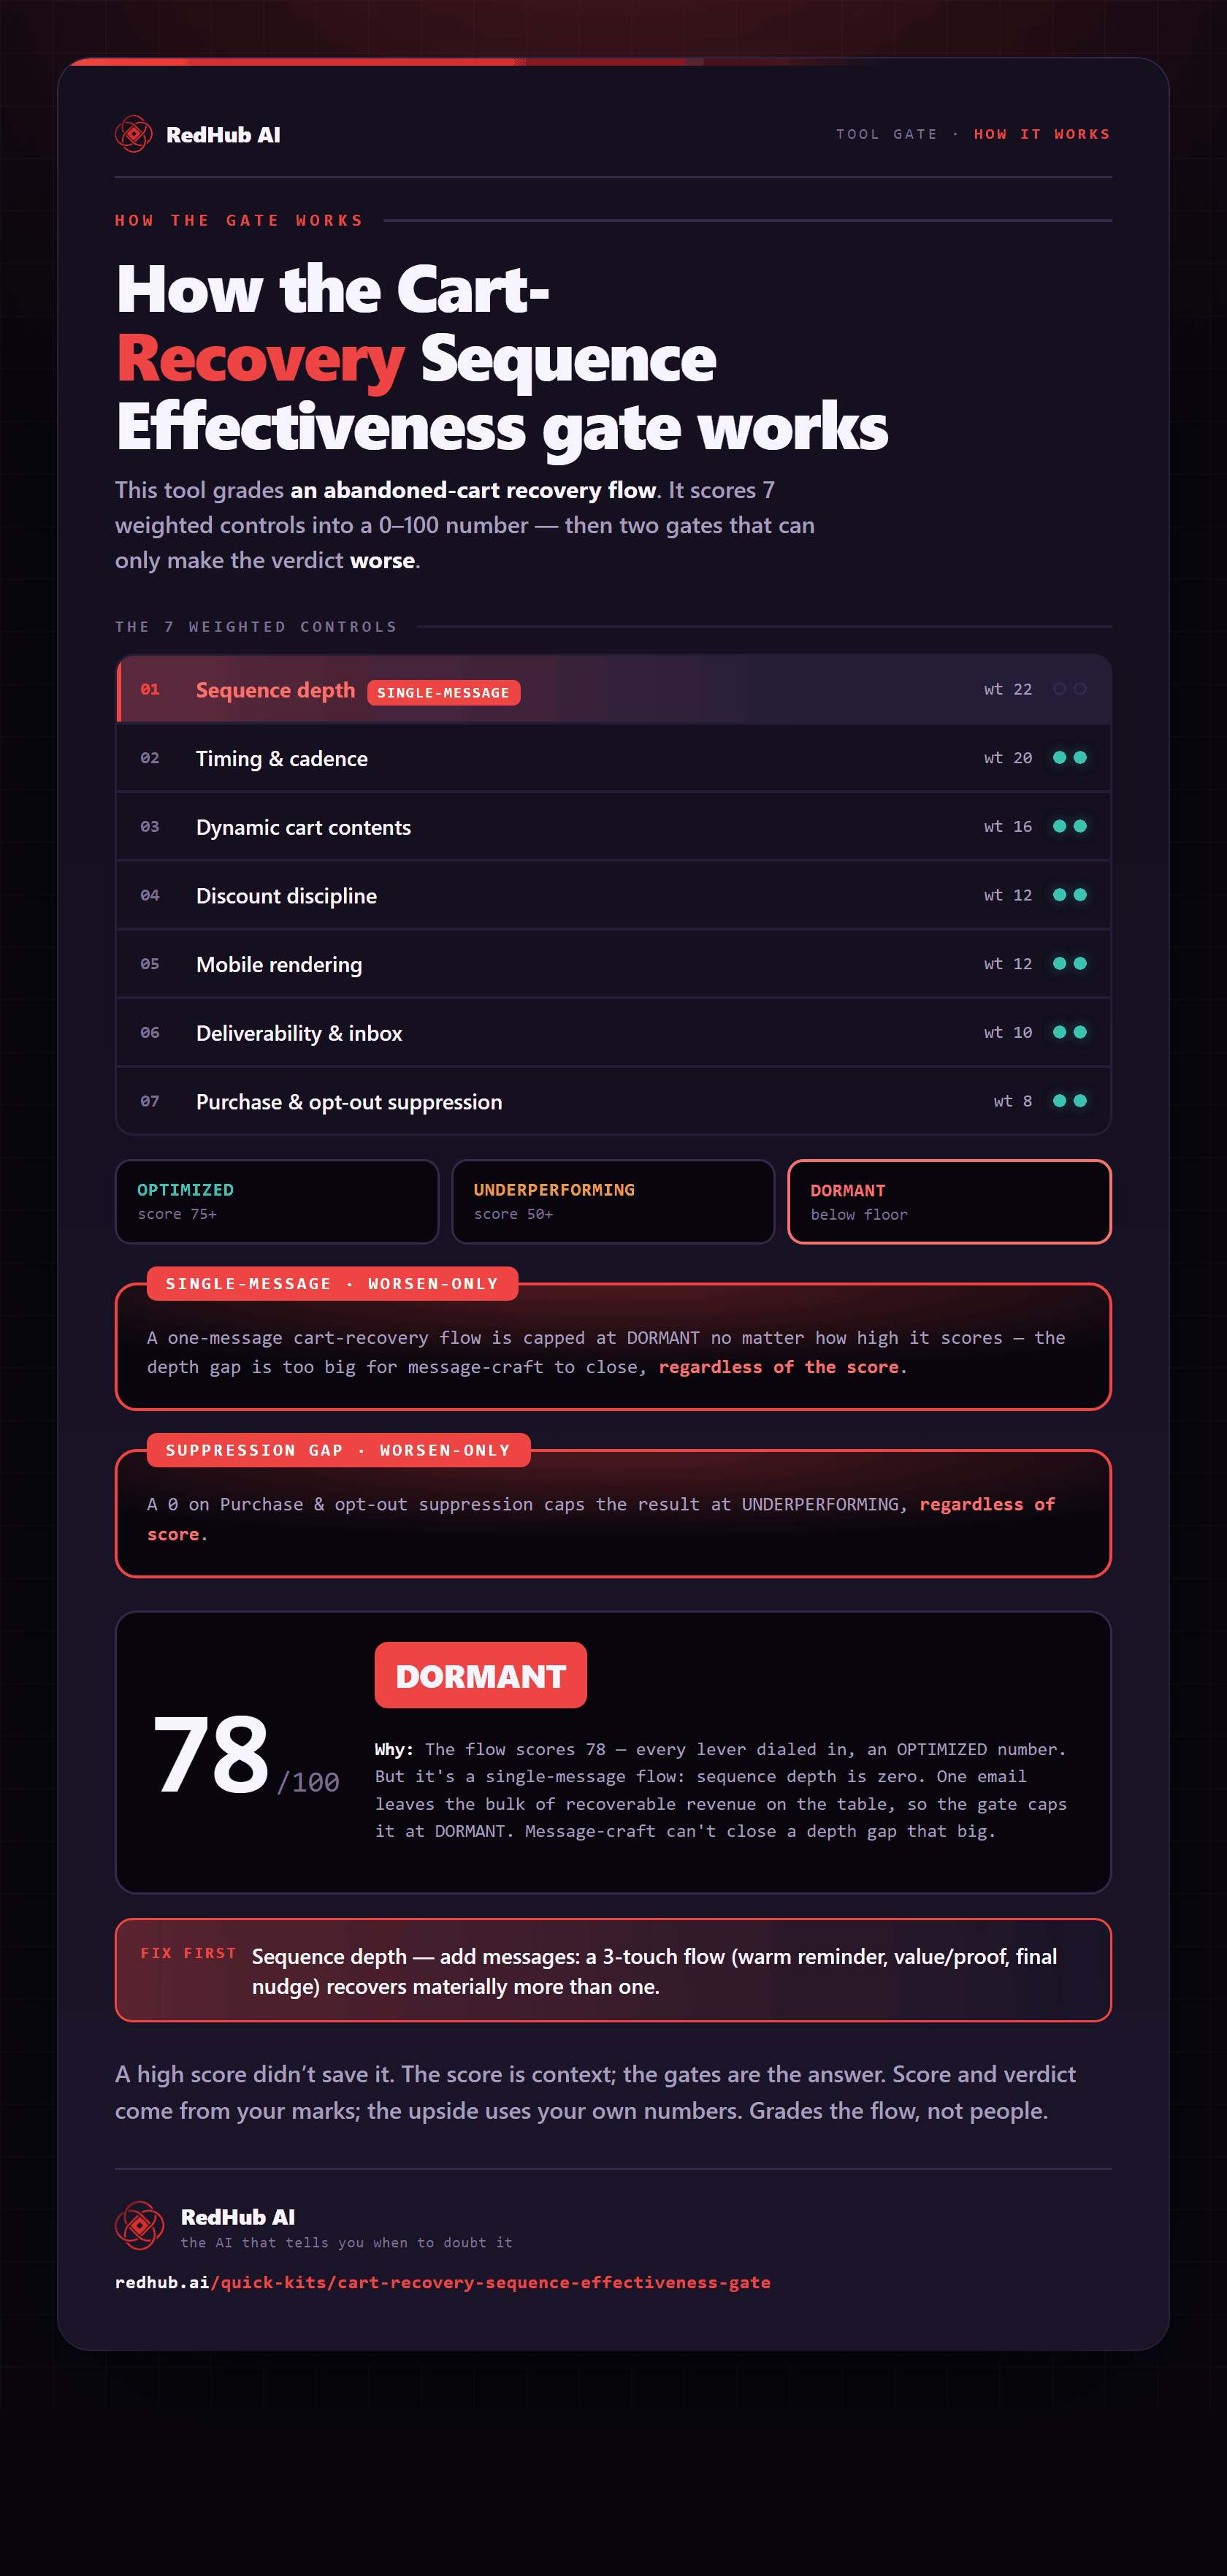
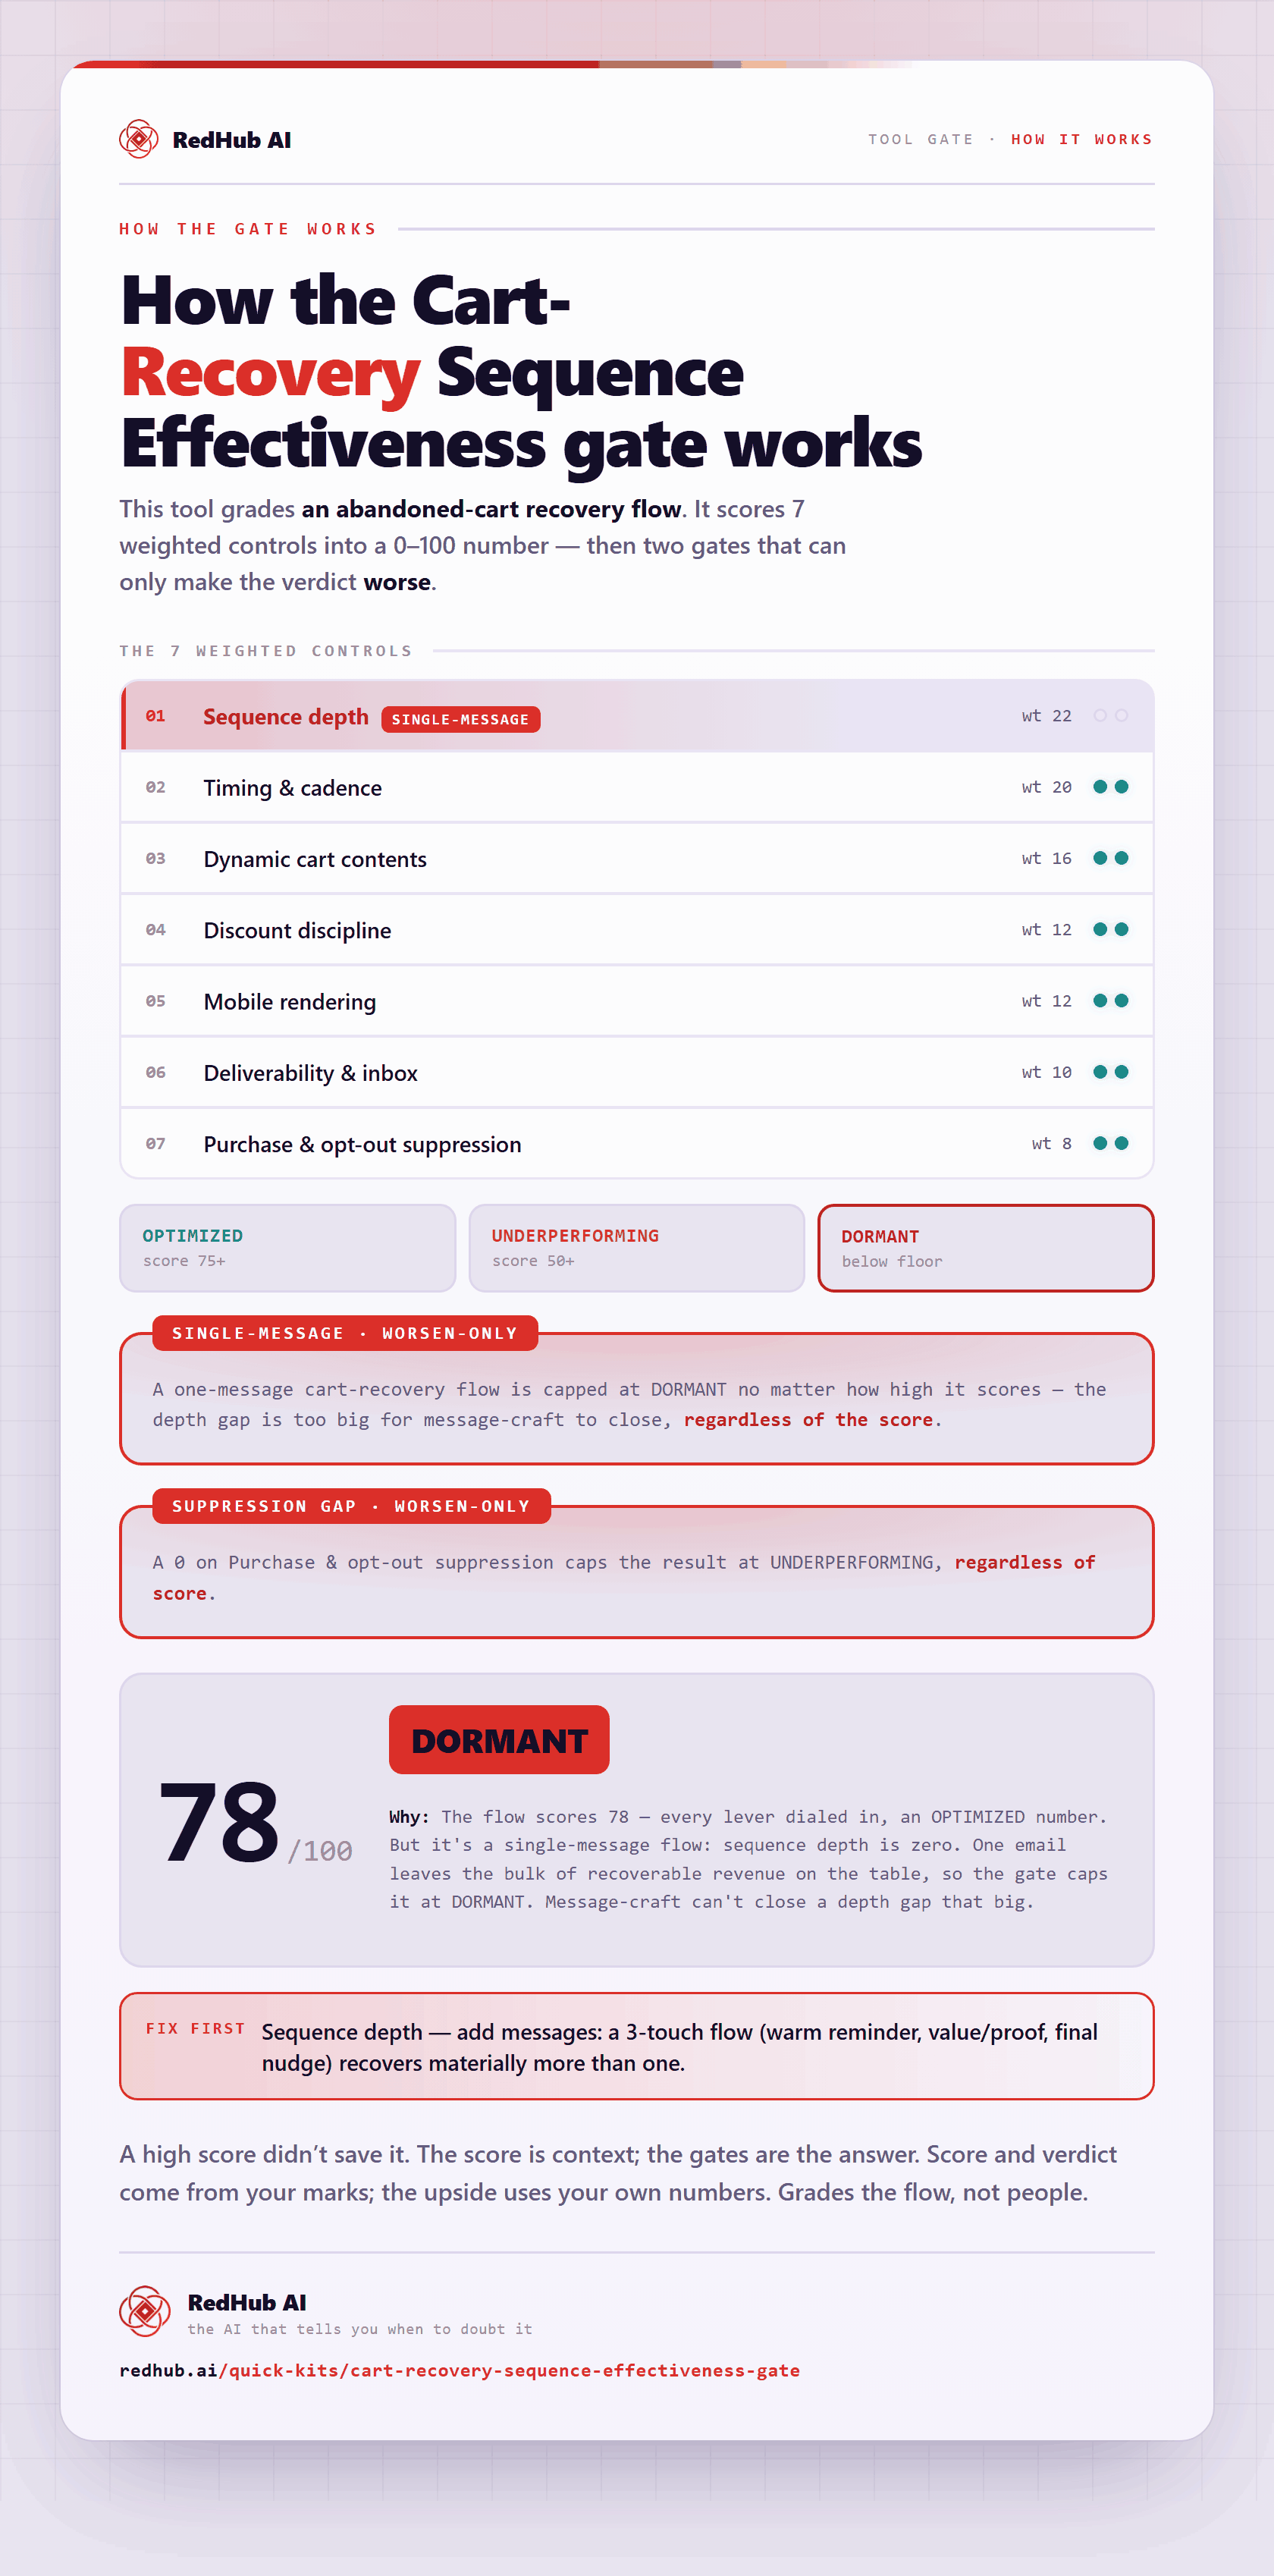
The gate this post refers to, drawn from the tool’s own logic. See the tool.