Company Scorecard: Targets, Red Lines, Honest Grades
Todd Brooks, Founder6 min read

Jump to a section10
- Build a Company Scorecard That Tells You the Truth
- TL;DR
- What is a company scorecard?
- Pick the areas: five to nine, across four lanes
- Targets grade the pace. Red lines guard the floor.
- Try the grading logic
- Roll up worst-first, never on average
- Two honesty rules that keep the scorecard alive
- Decision Guide
- FAQ
Build a Company Scorecard That Tells You the Truth
TL;DR
- What it is: A company scorecard is a short list of operating areas — cash, pipeline, customers, execution — each with a current value, a target, and a red line.
- Who it's for: Founders and leadership teams running a business operating cadence.
- How it works: Grade each area ON TRACK, WATCH, or OFF TRACK against pace to target. A crossed red line forces OFF TRACK — and forces the whole week OFF PLAN.
- Bottom line: A scorecard that can't say OFF PLAN is decoration. The floor gate is what makes it honest.
What is a company scorecard?
A company scorecard is a one-page list of five to nine operating areas that a leadership team grades every week. Each area carries three numbers: the current value from a real system, the target for this period, and a red line — a hard minimum (like runway) or maximum (like churn) the business must never cross. Each area grades ON TRACK, WATCH, or OFF TRACK by pace against target, and the week rolls up to STEADY, NEEDS ATTENTION, or OFF PLAN. A crossed red line overrides everything: that area is OFF TRACK regardless of pace, and the week is OFF PLAN.
Best for: founders who want the grading run automatically from their real systems — see the Operating Cadence Engine.
Most companies do not lack numbers. They lack verdicts. The dashboard shows forty metrics and answers zero questions, because no metric on it knows what "good" means this week. A company scorecard fixes that by attaching two judgments to every number — a target and a red line — so the number can grade itself. That is the whole trick: a scorecard is not a list of metrics. It is a list of metrics that can fail.
Pick the areas: five to nine, across four lanes
Cover the four lanes a company lives or dies on, with one to three areas each:
- Cash — runway in months, or cash collected this month.
- Pipeline — qualified pipeline value, or new opportunities per week. If pipeline is your shakiest lane, a dedicated grading pass like The Forecast Floor can feed this line with a committed floor instead of a hopeful total.
- Customers — churn rate, active customers, or at-risk accounts.
- Execution — shipped commitments, or delivery lead time.
Fewer than five areas leaves blind spots. More than nine turns the weekly review into a data recital. Every area needs an owner, a source system, a target, and a red line — an area missing any of the four is not ready for the scorecard.
Targets grade the pace. Red lines guard the floor.
These are two different jobs, and collapsing them is the most common scorecard mistake.
| Target | Red line | |
|---|---|---|
| Question | Are we pacing to plan? | Have we crossed a line we must never cross? |
| Grades to | ON TRACK / WATCH / OFF TRACK | OFF TRACK, no matter the pace |
| Moves | Each quarter, as the plan moves | Rarely — it is a survival constraint |
| Example | Runway target: 12 months | Runway minimum: 6 months |
The floor gate: when an area crosses its red line, it is OFF TRACK regardless of how the pace math looks, and the whole week is forced OFF PLAN until the line is back inside its limit. Without this rule, a crossed red line averages away inside six healthy areas and the week reads "fine" — which is precisely the week you needed the scorecard to catch. A bad week must read as a bad week. That is the point.
Try the grading logic
Here is the core of the grading, live. Enter a metric where higher is better — cash runway is the classic — with your target and your red-line minimum. The thresholds in this demo are illustrative (WATCH starts at 90% of target); the rule that matters is that the red line overrides the pace.
Grade one scorecard area
Drop the current value under the red line and watch the grade flip — no pace math can save it. This is the same shape of logic the Operating Cadence Engine runs across your whole scorecard every Monday, with the engine, the workbook, and the report all computing the same result.
Roll up worst-first, never on average
The weekly verdict — STEADY, NEEDS ATTENTION, OFF PLAN — must key off the worst area, not the average. Averages are where bad news hides: six ON TRACK areas and one crossed red line average to "pretty good," and "pretty good" is a lie. The rollup rule is simple: any crossed red line means OFF PLAN; multiple OFF TRACK areas mean OFF PLAN; an OFF TRACK or a couple of WATCHes mean NEEDS ATTENTION; otherwise STEADY. The verdict also names the one area to fix first — a verdict without a first move is just a mood.
Two honesty rules that keep the scorecard alive
- Not-connected is not zero. If you cannot pull an area's number from a real system this week, mark it not-measured — never type a guess. One invented number poisons trust in the whole page. This is a core rule of the Operating Cadence Engine: an unconnected source is reported as unconnected, and the system stops rather than fabricating.
- Grade areas, not people. The scorecard grades the business — cash, pipeline, churn, execution. The moment it becomes a personal report card, people start managing the number instead of the business, and the honesty dies. Discuss the grades in the weekly business review; fix systems, not scapegoats.
Get the scorecard graded for you, every Monday
The Operating Cadence Engine ($299, one-time) grades every area of your scorecard against the targets and red lines you set — reading your calendar, inbox, CRM, and metrics through your own connectors — and delivers the one-page verdict to your inbox. Floor gate included; invented numbers excluded, by design.
Get the Operating Cadence Engine — $299 →Decision Guide
Use it if: your dashboard has plenty of numbers but no verdicts, and "are we on plan?" still gets answered by feel.
Skip it if: you cannot yet pull any metric from a real system — connect one source first, because a scorecard of guesses is worse than no scorecard.
Best first step: write one area per lane — cash, pipeline, customers, execution — each with a target and a red line. Grade them this Monday by hand.
FAQ
What is a company scorecard?
A one-page list of five to nine operating areas, each with a current value from a real system, a target, and a red line. Each area grades ON TRACK, WATCH, or OFF TRACK, and the week rolls up to STEADY, NEEDS ATTENTION, or OFF PLAN.
How is a scorecard different from a dashboard?
A dashboard shows numbers; a scorecard grades them. The difference is the target and the red line attached to every metric — they let the number fail, which is what makes it useful.
What is a red line metric?
A hard limit the business must never cross — a minimum like months of runway or a maximum like churn rate. Crossing it forces the area OFF TRACK regardless of pace and forces the week OFF PLAN until it is back inside the limit.
Why not average the grades into one score?
Because averages hide the one number that matters. Six healthy areas and one crossed red line average to "fine" — and that is exactly the week the scorecard exists to catch. Roll up worst-first, always.
What if we can't measure an area yet?
Mark it not-measured and say so on the page. Never estimate it to fill the cell. An honest gap keeps the rest of the page trustworthy; a guessed number quietly poisons all of it.
How often should targets and red lines change?
Targets move with the plan — usually quarterly. Red lines are survival constraints and should almost never move; if you find yourself moving a red line to make a week look better, the scorecard has stopped being honest.
One honest page beats forty charts
Targets, red lines, the floor gate, and a Monday verdict — delivered from your own systems, with the judgment left where it belongs: with you.
See the Operating Cadence Engine →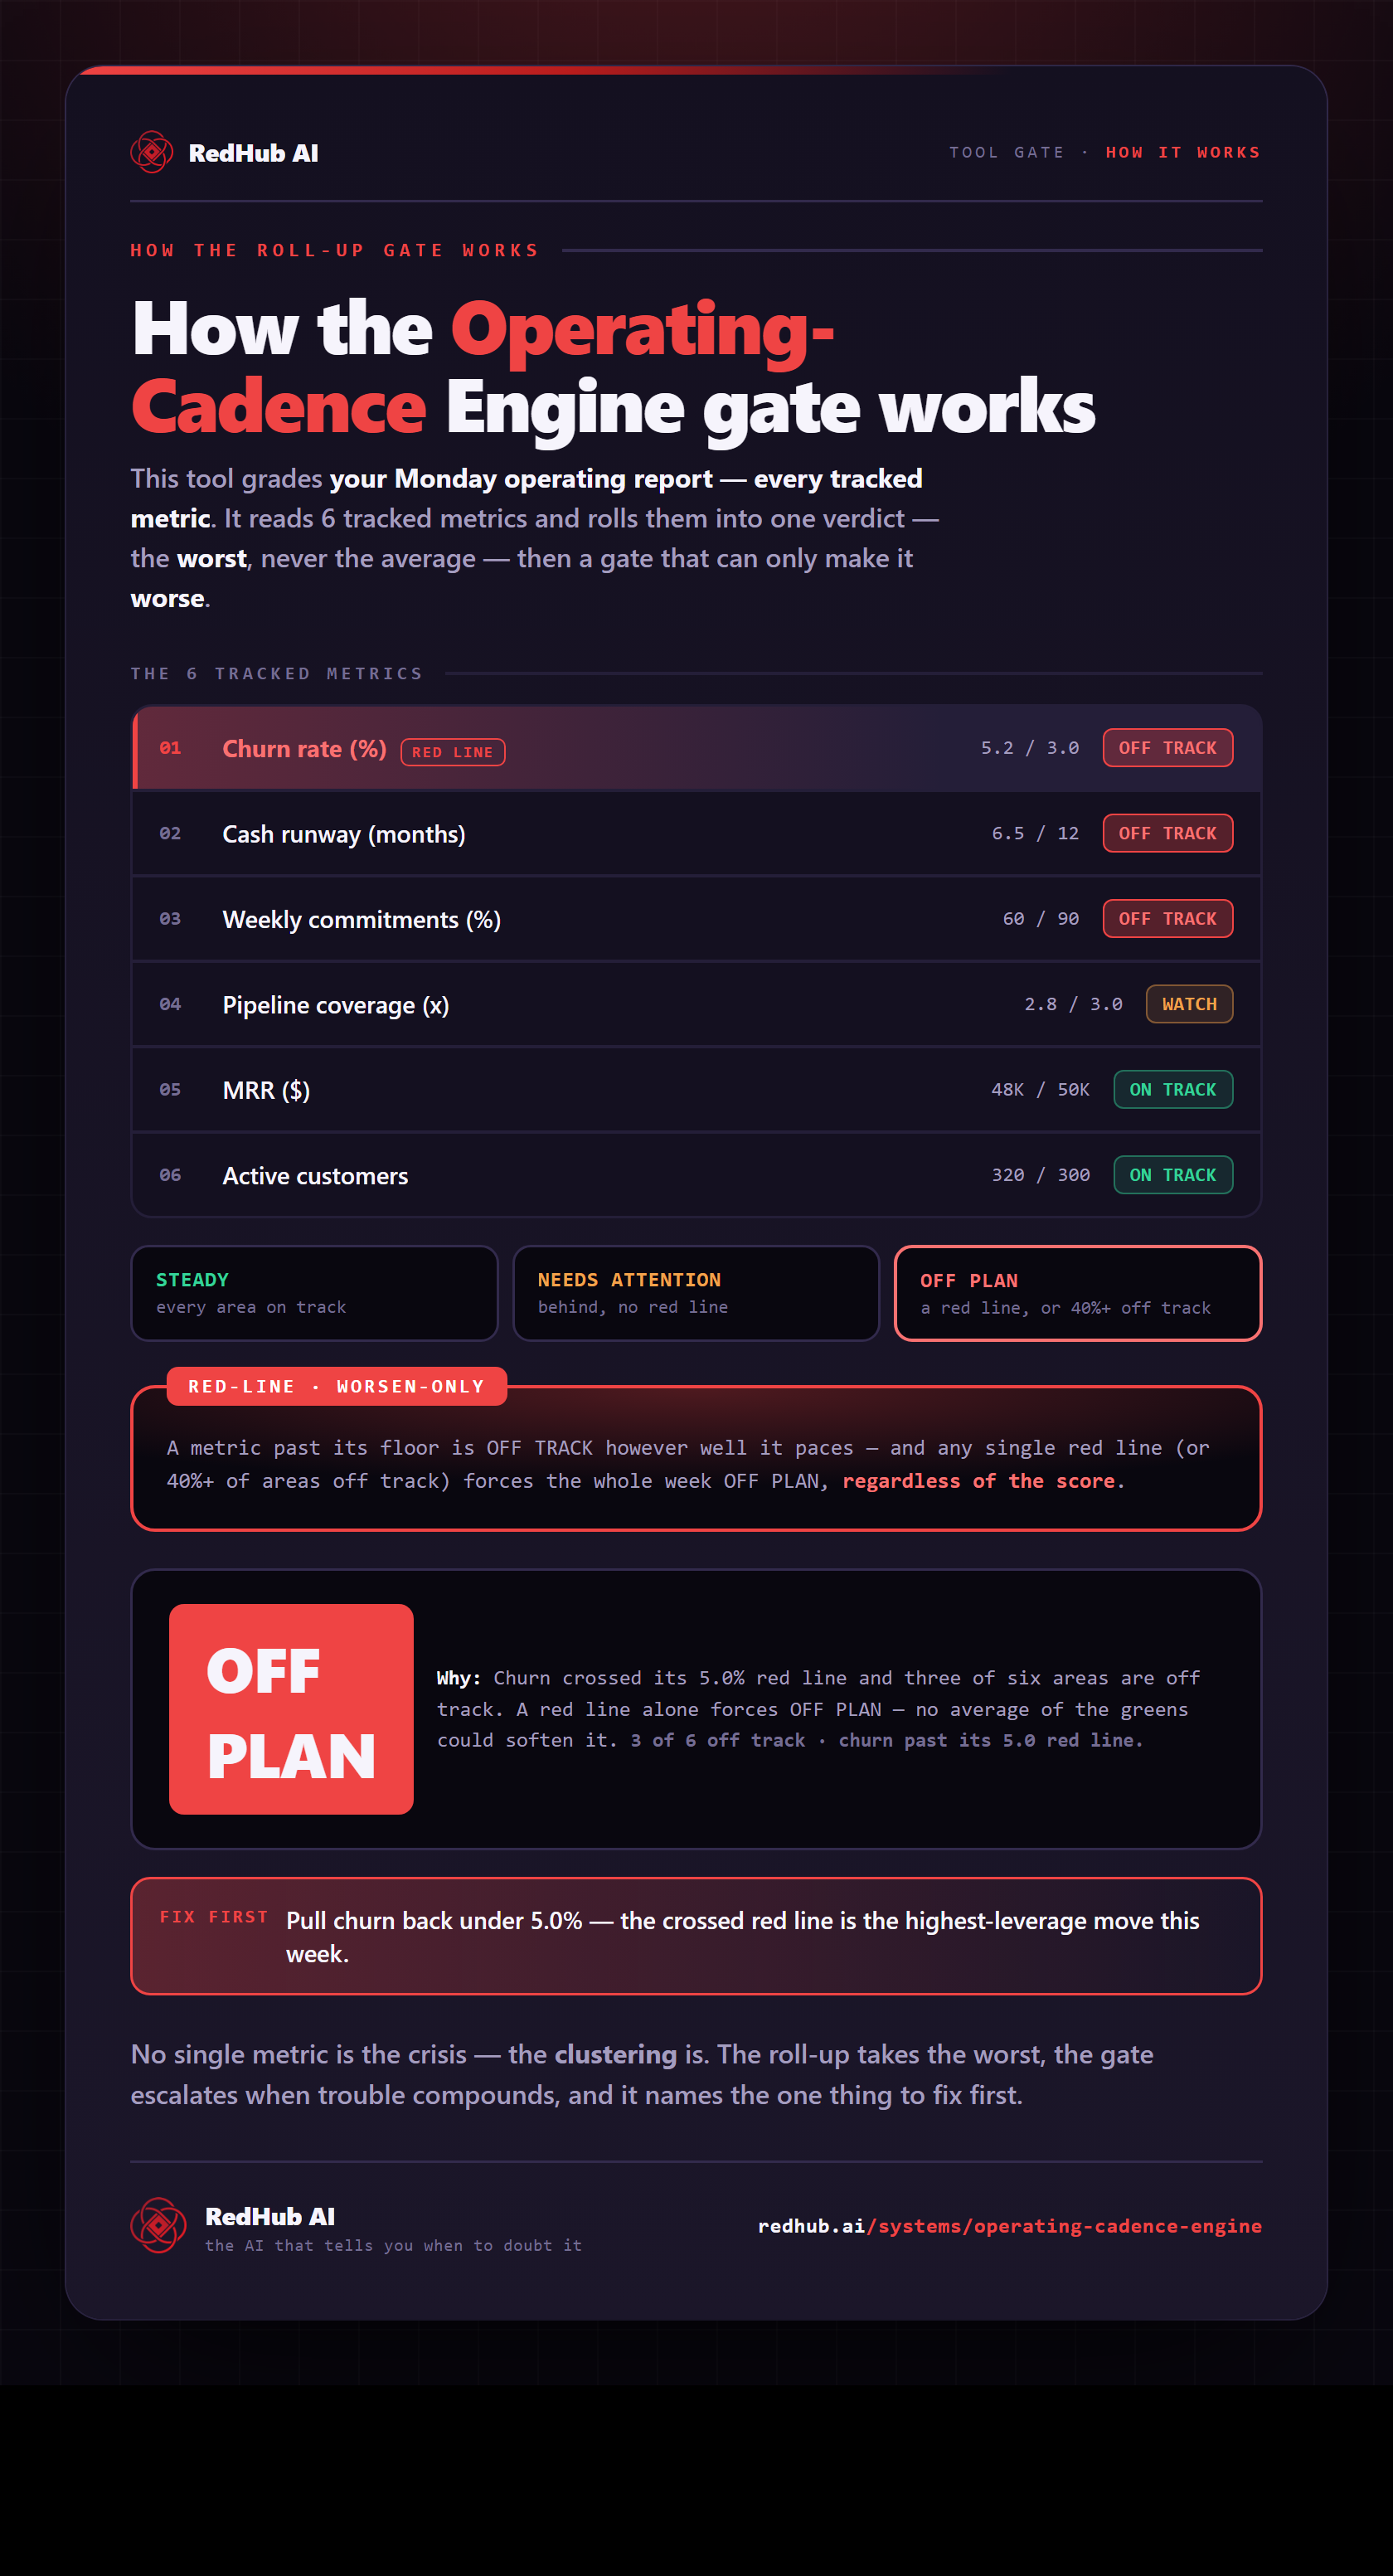
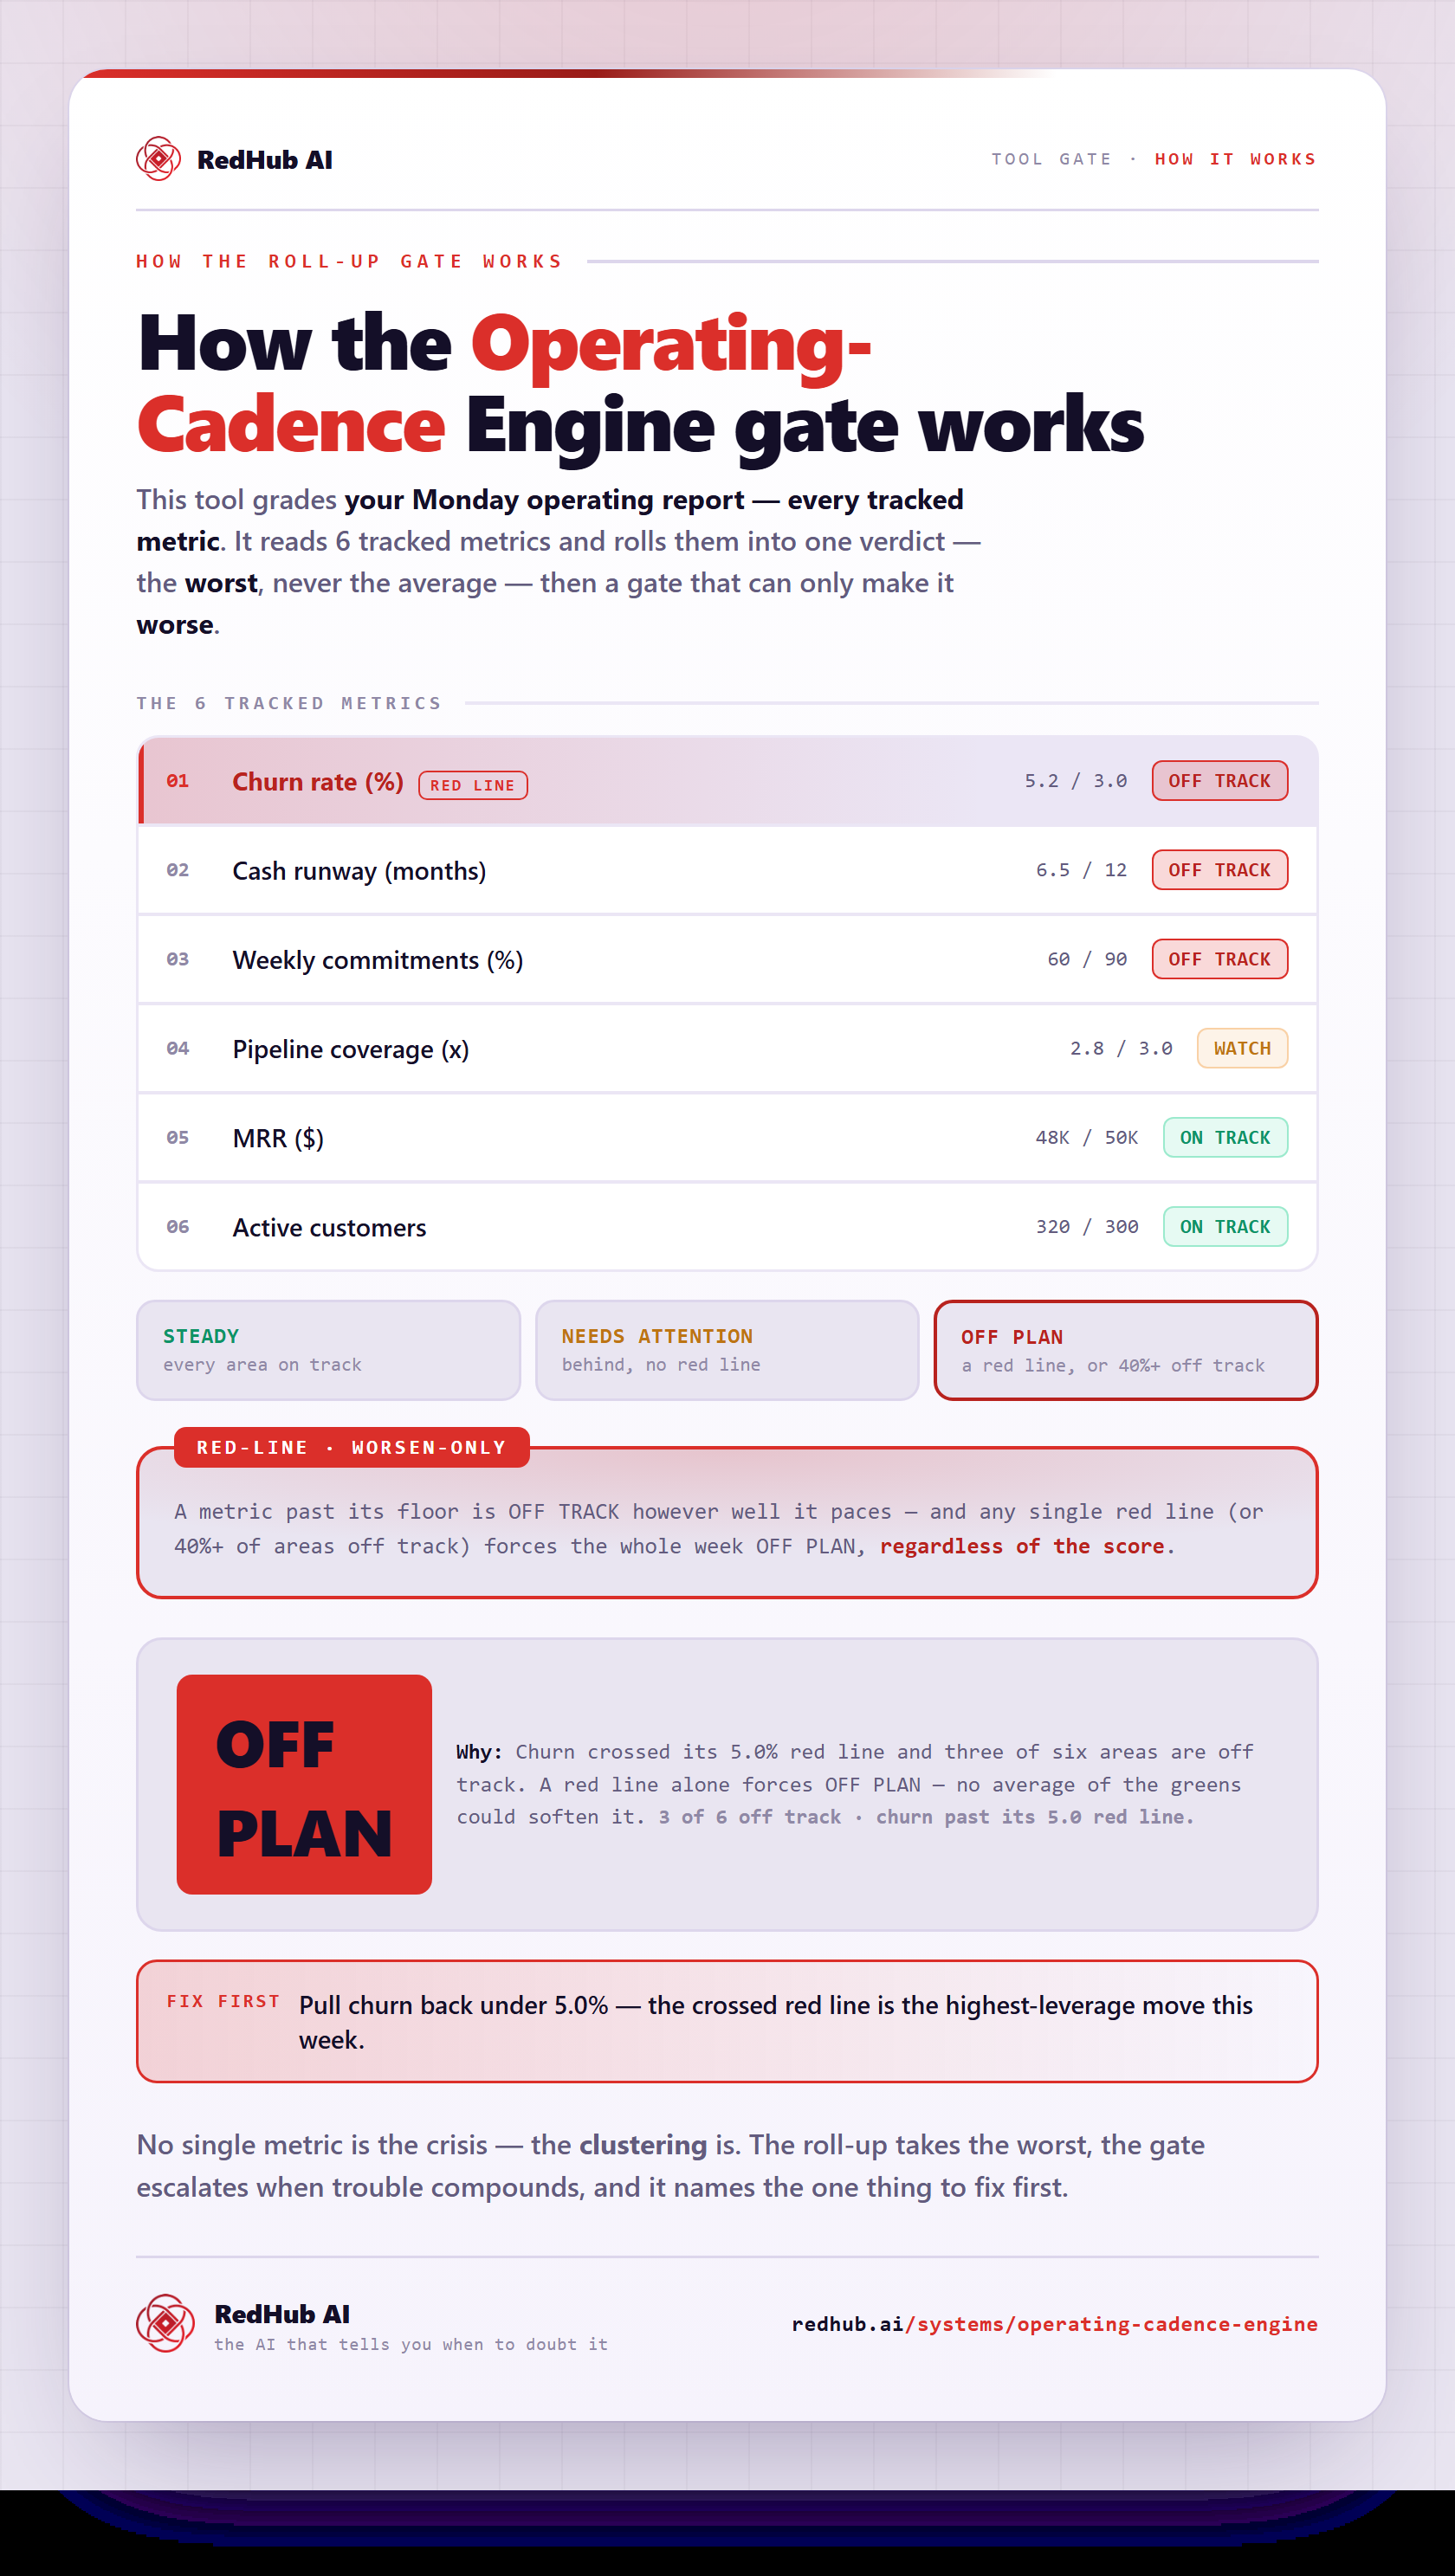
The gate this post refers to, drawn from the tool’s own logic. See the tool.