How to Find Your Cost-Per-Lead Breakeven (Before You Scale)
RedHub AI Editorialupdated October 7, 20266 min read

Jump to a section8
To find your cost per lead breakeven, multiply two numbers: the gross profit you make on a new customer, and the share of your leads who become customers. The result is the most a lead can cost before each one loses money. A business that makes $500 per customer and converts 4% of its leads breaks even at $20 a lead. That line sits before overhead, so the price worth paying is lower. It is also only as good as the two numbers you put in, and one of them is usually an estimate from a small sample.
TL;DR: Breakeven cost per lead = gross profit per new customer × lead-to-customer conversion rate. It is a ceiling measured before sales time, tools and wasted spend, so set your working line below it. No published benchmark can stand in for it. The Paid-Lead Breakeven Line ($49) computes the line from your own numbers and reads each paid source PROFITABLE, THIN or UNDERWATER against it. The rest of this guide covers what counts as a good cost per lead, max cost per lead by channel, cost per lead vs cost per acquisition, and when to scale or kill a paid channel.
The formula has two inputs
Gross profit per new customer is what the customer pays you minus what it costs to deliver the work. Use profit here. Revenue would set the ceiling as if delivery were free. Conversion rate is customers won divided by leads received, from the same source over the same period.
In that made-up case, $20 is the line. At $15 a lead, the business keeps $5 of gross profit for every lead it buys. At $45, it loses $25 on each one. The same $45 lead is comfortable for a business whose line is $80. A lead price means nothing until it stands next to the line of the business paying it.
Breakeven is a ceiling, not a target
At the line, a lead returns what it cost. Nothing is left for the sales hours spent on leads that did not close, the CRM seats, or your own time reading the pipeline. Run a channel at breakeven and it loses money once those are counted.
So pick a margin and draw a second, lower line. With a 33% margin, a $20 breakeven becomes a working line of $13.40. How much margin you need depends on what your sales process costs to run. Nobody outside your business can hand you that figure.
Run your own numbers
Enter your gross profit and your conversion rate. The calculator does one multiplication.
Find your max profitable cost-per-lead
The conversion rate is the soft number
Gross profit comes out of your books. The conversion rate comes from counting, and small counts move a lot. Fifty leads and 2 customers is 4%, which gives the $20 line. One more customer makes it 6% and $30. One fewer makes it 2% and $10. The line tripled across a difference of two sales.
Two habits help. Use the longest recent stretch in which your sales process did not change. Leave out leads too new to have had time to close, because they drag the rate down for a reason unrelated to the source. Neither habit removes the problem. A line built on 50 leads is a range wearing a single number, and you will be setting budgets against the single number anyway.
No benchmark can do this for you
We are not going to give you an average cost per lead for your industry. A number built from other companies' margins tells you what they paid. It says nothing about what you can afford.
A $5 lead loses money for a business that makes $100 per customer and converts 2% of its leads, because its line is $2. A $200 lead is far under the line for a business that makes $10,000 per customer and converts 20%, because its line is $2,000. Our post on what counts as a good cost per lead covers the one thing a benchmark is still useful for.
What the Paid-Lead Breakeven Line does with this
The Paid-Lead Breakeven Line ($49) is one .xlsx. You enter four things once: client value, qualified-lead rate, close rate and target margin. It multiplies the two rates to get clients per raw lead, which is the conversion rate in this guide. Then it computes a breakeven cost per lead and a profit line below it.
Its worked example uses a $6,000 client value, a 30% qualified-lead rate and a 5% close rate. That makes 1.5% of raw leads into clients and puts breakeven at $90 a lead. A 33% target margin sets the profit line at about $60.
You then add a row per source with its monthly spend, leads, clients won and cost per lead. Each source reads PROFITABLE at or under the profit line, THIN between the two lines, or UNDERWATER above breakeven. Two guardrails sit on top. A source with fewer than 10 leads reads INSUFFICIENT DATA. A source that has closed zero clients reads UNDERWATER however cheap its leads are. In the worked example, a source paying $14 a lead reads UNDERWATER because 140 leads produced no clients.
Three limits are worth knowing before you buy. The kit's own notes define client value as lifetime value or first-year revenue, less what it costs you to serve the client, which is the gross profit figure this guide uses. Enter raw revenue there and the line reads higher than your real breakeven. The kit also sets one line for the whole business from one pair of rates, so if your channels convert at different rates, rerun it with each channel's own. And it does not lower your cost per lead, write your ads or fix your targeting. It keeps score.
See which paid sources clear your line
The Paid-Lead Breakeven Line computes your breakeven cost per lead and your profit line from your own client value and close rates, then reads every source PROFITABLE, THIN or UNDERWATER. One .xlsx with a worked six-source example you overwrite. Not financial advice.
Get the Paid-Lead Breakeven Line — $49Pairs well with
The CAC & Payback Calculator ($49) covers what a per-lead line leaves out: CAC, payback period, LTV and LTV:CAC per acquisition channel, with an invest, hold or cut verdict. The Lead Source ROI Scorecard ($49) grades each source after the fact on qualified-lead rate, cost per qualified lead, close rate and ROAS, and returns SCALE, FIX or CUT. The Inbound Lead Qualification Engine ($99) scores the leads a source sends and returns PURSUE NOW, NURTURE or DISQUALIFY for each one.
More in this guide
How do I find my cost per lead breakeven?
Multiply your gross profit per new customer by your lead-to-customer conversion rate. A business making $500 per customer and converting 4% of leads breaks even at $20 a lead. Above that price, each lead costs more than it returns.
Is breakeven the price I should aim to pay?
No. Breakeven is measured before sales time, tools and wasted spend, so paying it means losing money once those are counted. Pick a margin and set a lower working line. A 33% margin turns a $20 breakeven into $13.40.
Should I use revenue or gross profit in the formula?
Gross profit: what the customer pays minus what it costs to deliver. Using revenue sets the ceiling as if delivery cost nothing, so the line comes out higher than your margin can cover.
How many leads do I need before the conversion rate is reliable?
More than most people use. With 50 leads, one sale more or less moves a 4% rate to 6% or 2%, and a $20 line to $30 or $10. Use the longest recent stretch in which your sales process stayed the same.
Is cost per lead breakeven the same as CAC?
No. Breakeven cost per lead is a ceiling on the price of one lead. CAC is total sales and marketing spend divided by new customers won, so it includes sales time and tools. A source can sit under its lead ceiling and still be part of a CAC that is too high.
Does the Paid-Lead Breakeven Line improve my ad performance?
No. It computes your breakeven and profit lines and reads each source PROFITABLE, THIN or UNDERWATER against them. It does not lower your cost per lead, write ads or change targeting. This is general information, not financial advice.
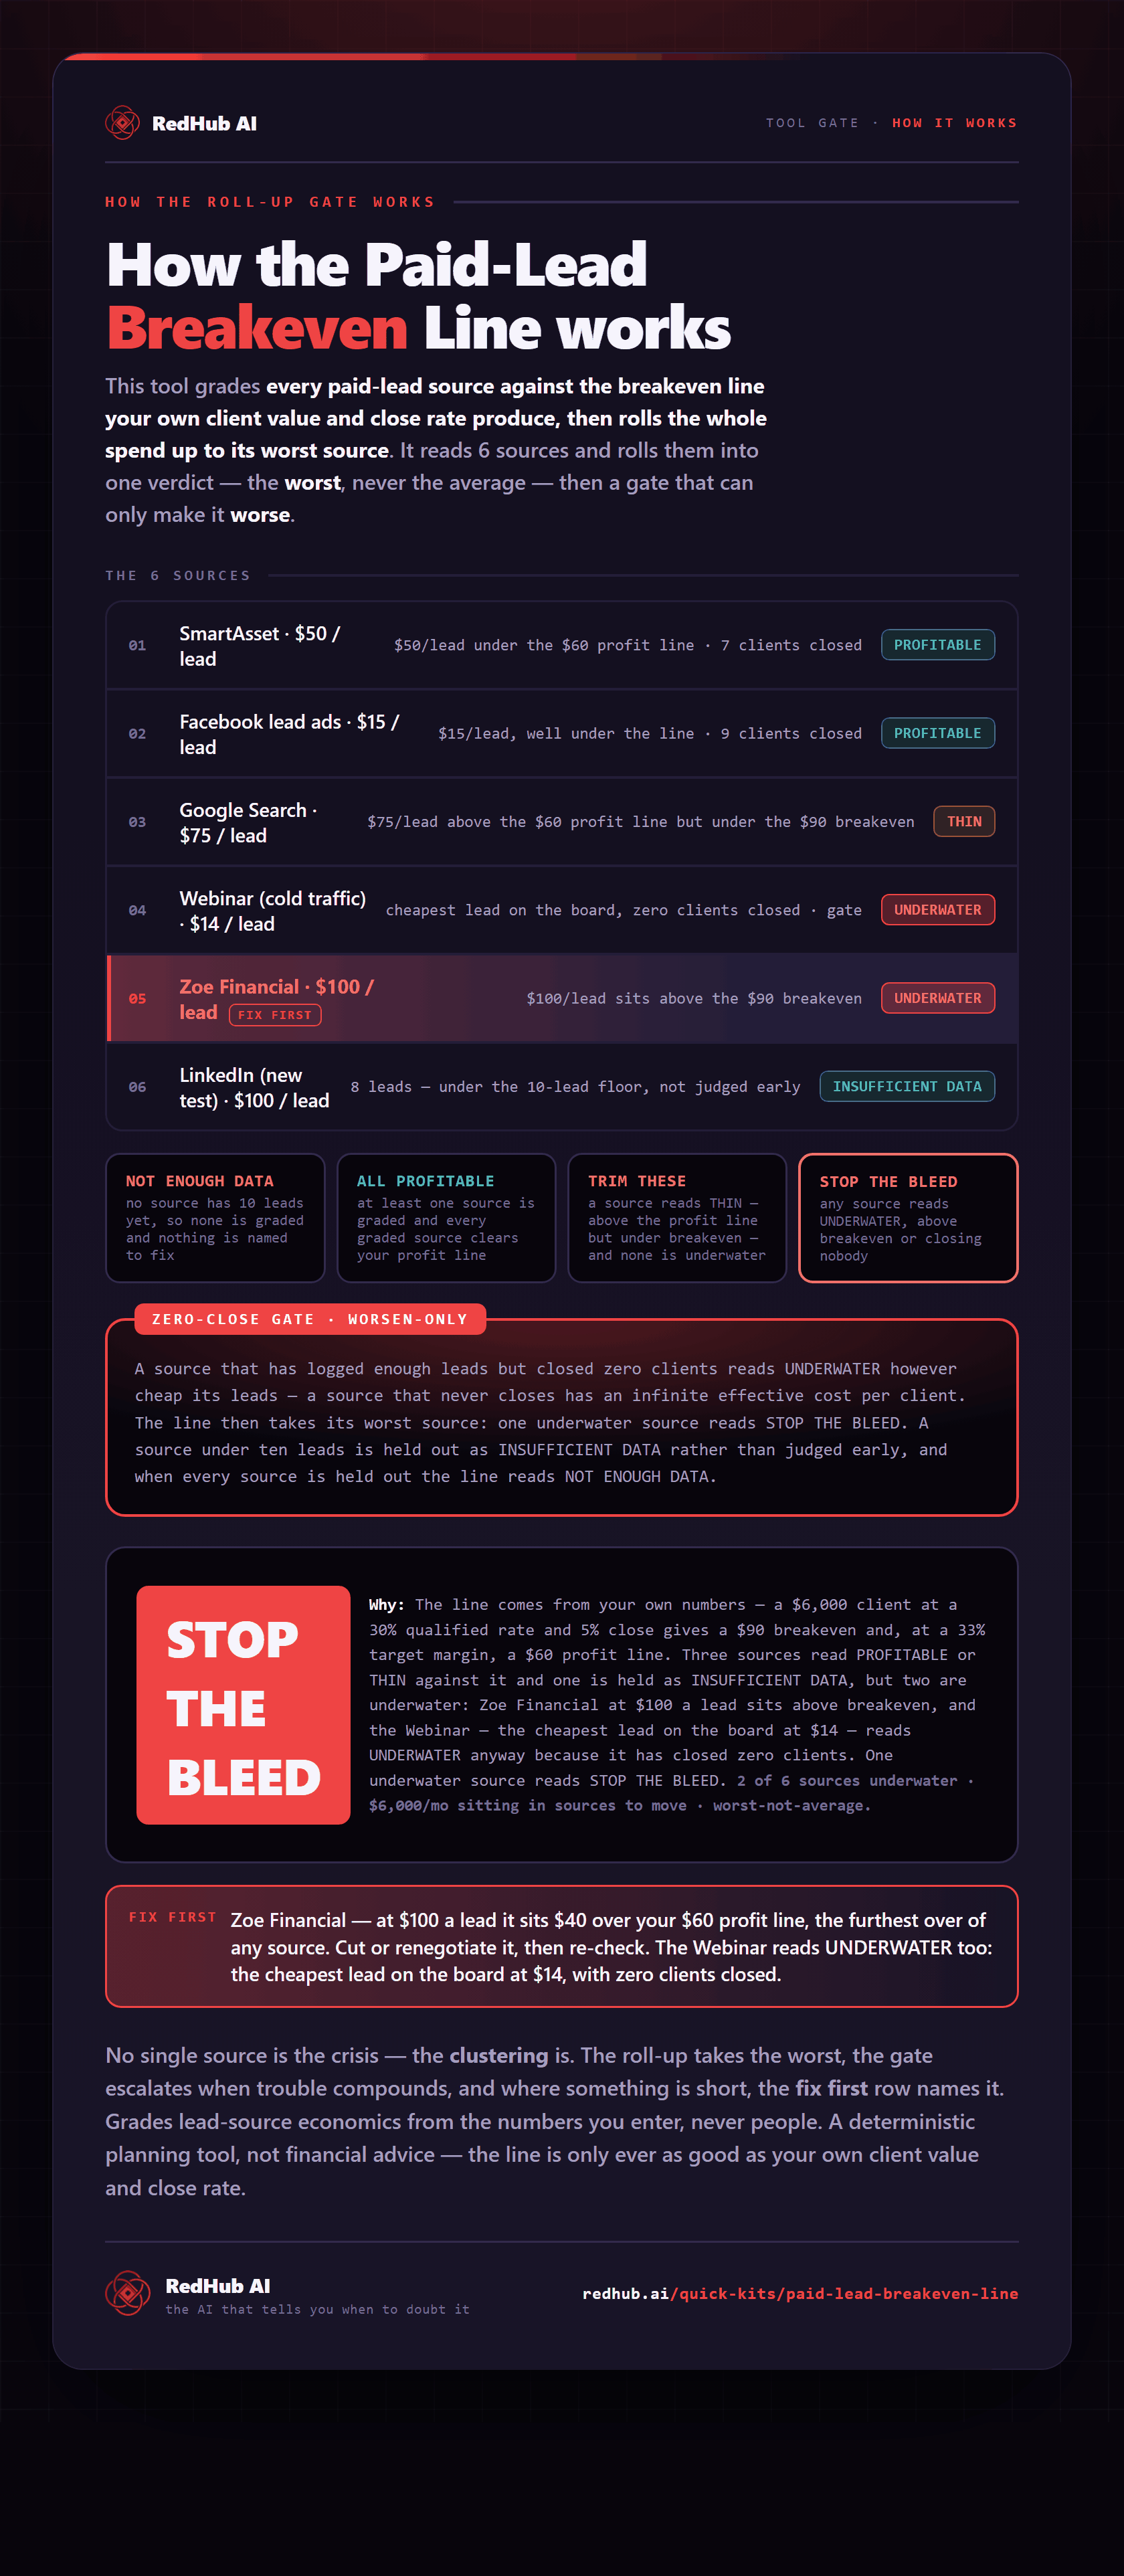
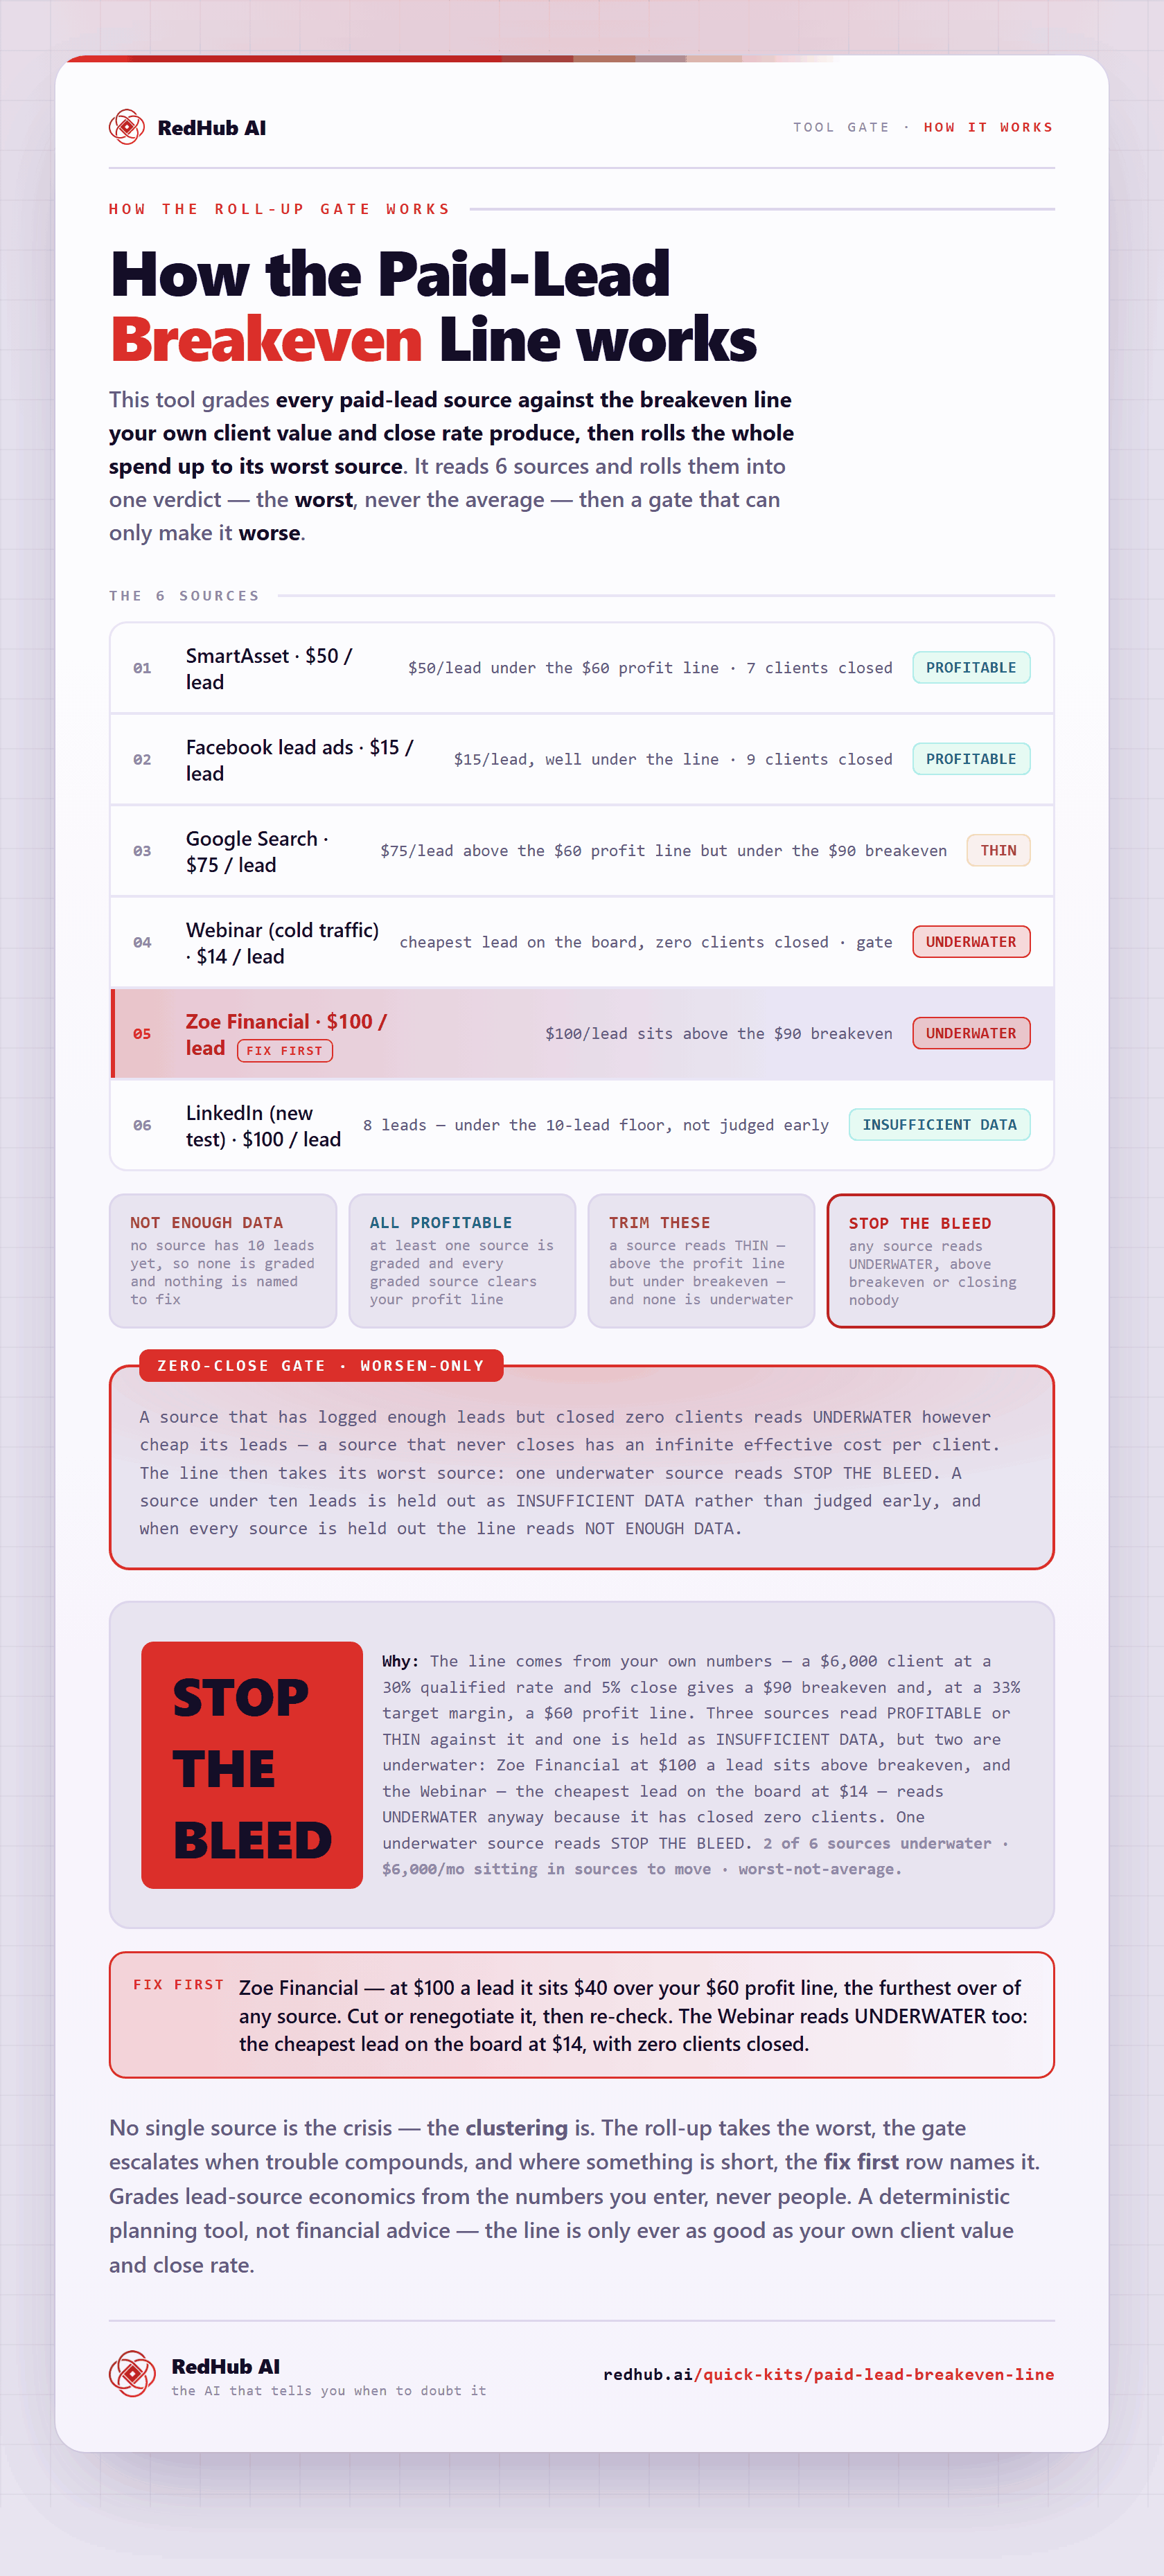
The gate this post refers to, drawn from the tool’s own logic. See the tool.