What's a Good Cost-Per-Lead? (Why the Honest Answer Is "It Depends")
RedHub AI Editorialupdated October 7, 20265 min read

Jump to a section7
No published number can tell you a good cost per lead, because the answer is set by two figures only you have: the gross profit you make on a new customer and the share of your leads who become customers. Multiply them and you get your breakeven line. A good cost per lead is any price comfortably under that line. A lead at $15 is too expensive for one business and a lead at $80 is a fair price for another, and the three made-up companies below show why.
TL;DR: A good cost per lead is one that sits under your own breakeven cost per lead (gross profit per new customer × conversion rate), with margin to spare. Benchmarks report what other companies paid and cannot tell you what you can afford. They are still worth a look for one narrow reason, covered below. The Paid-Lead Breakeven Line ($49) computes your line from your own numbers. Start with the pillar: How to Find Your Cost-Per-Lead Breakeven.
Three businesses, three different answers
Breakeven cost per lead is gross profit per new customer times the lead-to-customer conversion rate. Here it is for three hypothetical companies.
| Business (hypothetical) | Gross profit / customer | Conversion rate | Breakeven cost per lead |
|---|---|---|---|
| Local service, low ticket | $150 | 10% | $15 |
| Software, mid ticket | $500 | 4% | $20 |
| Consulting, high ticket | $4,000 | 2% | $80 |
The consulting firm converts the fewest leads and still has the highest ceiling by far. If all three paid $30 a lead, the local service would lose $15 on every lead, the software company would lose $10, and the consulting firm would keep $50. Same price, three verdicts. Asking whether $30 is good has no answer until you say which row you are.
What a benchmark measures
Search for average cost per lead and you will find charts sorted by industry. Before you use one, ask how it was built. Who answered? Was the figure pulled from ad accounts or typed into a survey? Does "lead" mean a form fill, a phone call or a booked meeting? And who published it?
Even a carefully built chart reports one thing: what other companies paid. It blends businesses with different margins, different sales cycles and different definitions of a lead. Your ceiling is not in there, because your gross profit and your conversion rate are not in there.
Where a benchmark is still useful
There is one question a benchmark helps with, and it is a different question. It gives you a rough idea of what the market will charge you.
Say your line is $20 and every source you can find puts leads in your category at several times that. The charts cannot tell you the channel will fail. They do tell you to expect a hard time getting under your line, and to run a small test before a large one. So we would not throw them out. Read them as a price forecast, and get your ceiling from your own books.
How much weight to give that forecast is a judgment call. A business with an unusual offer or a strong referral reputation can land well under the going rate, and a newcomer can land well over it. The only way to find out is to buy some leads and count.
How to find your own number
- Find your gross profit per new customer. Take the revenue from a typical new customer and subtract the direct cost of delivering the work.
- Find your conversion rate. Pull the last 90 days of leads from one source and divide customers won by leads received. Leave out leads too new to have closed.
- Multiply the two. That is your breakeven cost per lead. Above it, each lead costs more than it returns. At it, you lose money once sales time and tools are counted.
- Set a working line below it. Pick the margin you want and reduce the ceiling by that share. A 33% margin turns $20 into $13.40.
- Repeat for each source if your sources convert at different rates. One shared figure will be wrong for at least one of them.
What the kit does with your numbers
The Paid-Lead Breakeven Line ($49) asks for client value, qualified-lead rate, close rate and a target margin, then computes a breakeven cost per lead and a lower profit line. Each source you enter reads PROFITABLE, THIN or UNDERWATER against those two lines. A source with fewer than 10 leads reads INSUFFICIENT DATA, so a thin test is not judged early.
It has no industry average built in, which is the point. It also sets one line for the whole business from one pair of rates. If your sources convert very differently, run it once per source with that source's rates. Our post on max cost per lead shows what a single blended line gets wrong.
Get your own line
The Paid-Lead Breakeven Line computes the most you can pay per lead from your own client value and close rates, then reads each source PROFITABLE, THIN or UNDERWATER. One .xlsx, no industry multiplier. Not financial advice.
Get the Paid-Lead Breakeven Line — $49Pairs well with
The Lead Source ROI Scorecard ($49) grades each source on qualified-lead rate, cost per qualified lead, close rate and ROAS and returns SCALE, FIX or CUT. The CAC & Payback Calculator ($49) works out CAC, payback period and LTV:CAC per acquisition channel. If the conversion rate is the weak input, the Lead-Capture Page Kit ($79) grades an opt-in page 0 to 100 on six levers and returns GO LIVE, TIGHTEN or REWORK.
More in this guide
What is a good cost per lead?
Any price comfortably under your own breakeven cost per lead, which is your gross profit per new customer times your lead-to-customer conversion rate. A business making $500 per customer and converting 4% of leads has a ceiling of $20.
Why can't I use an industry benchmark?
A benchmark reports what other companies paid. It blends different margins, sales cycles and definitions of a lead, and it does not contain your gross profit or your conversion rate, which are the two numbers that set your ceiling.
Are benchmarks useless, then?
No. They give a rough forecast of what the market will charge you. If the going rate is several times your ceiling, expect a hard time on that channel and test small first. Your ceiling still comes from your own books.
Is a lower cost per lead always better?
No. A $10 lead that converts at 1% costs $1,000 in leads per customer. A $40 lead that converts at 5% costs $800. Judge each source against its own ceiling, not against another source's price.
Should I pay right up to my breakeven?
No. Breakeven is measured before sales time and tools, so paying it loses money once those are counted. Pick a margin and set a lower working line. A 33% margin turns a $20 ceiling into $13.40.
Should one number cover all my lead sources?
Only if they convert at similar rates. Sources that convert differently have different ceilings, so a single shared figure will be too generous to one and too strict with another.
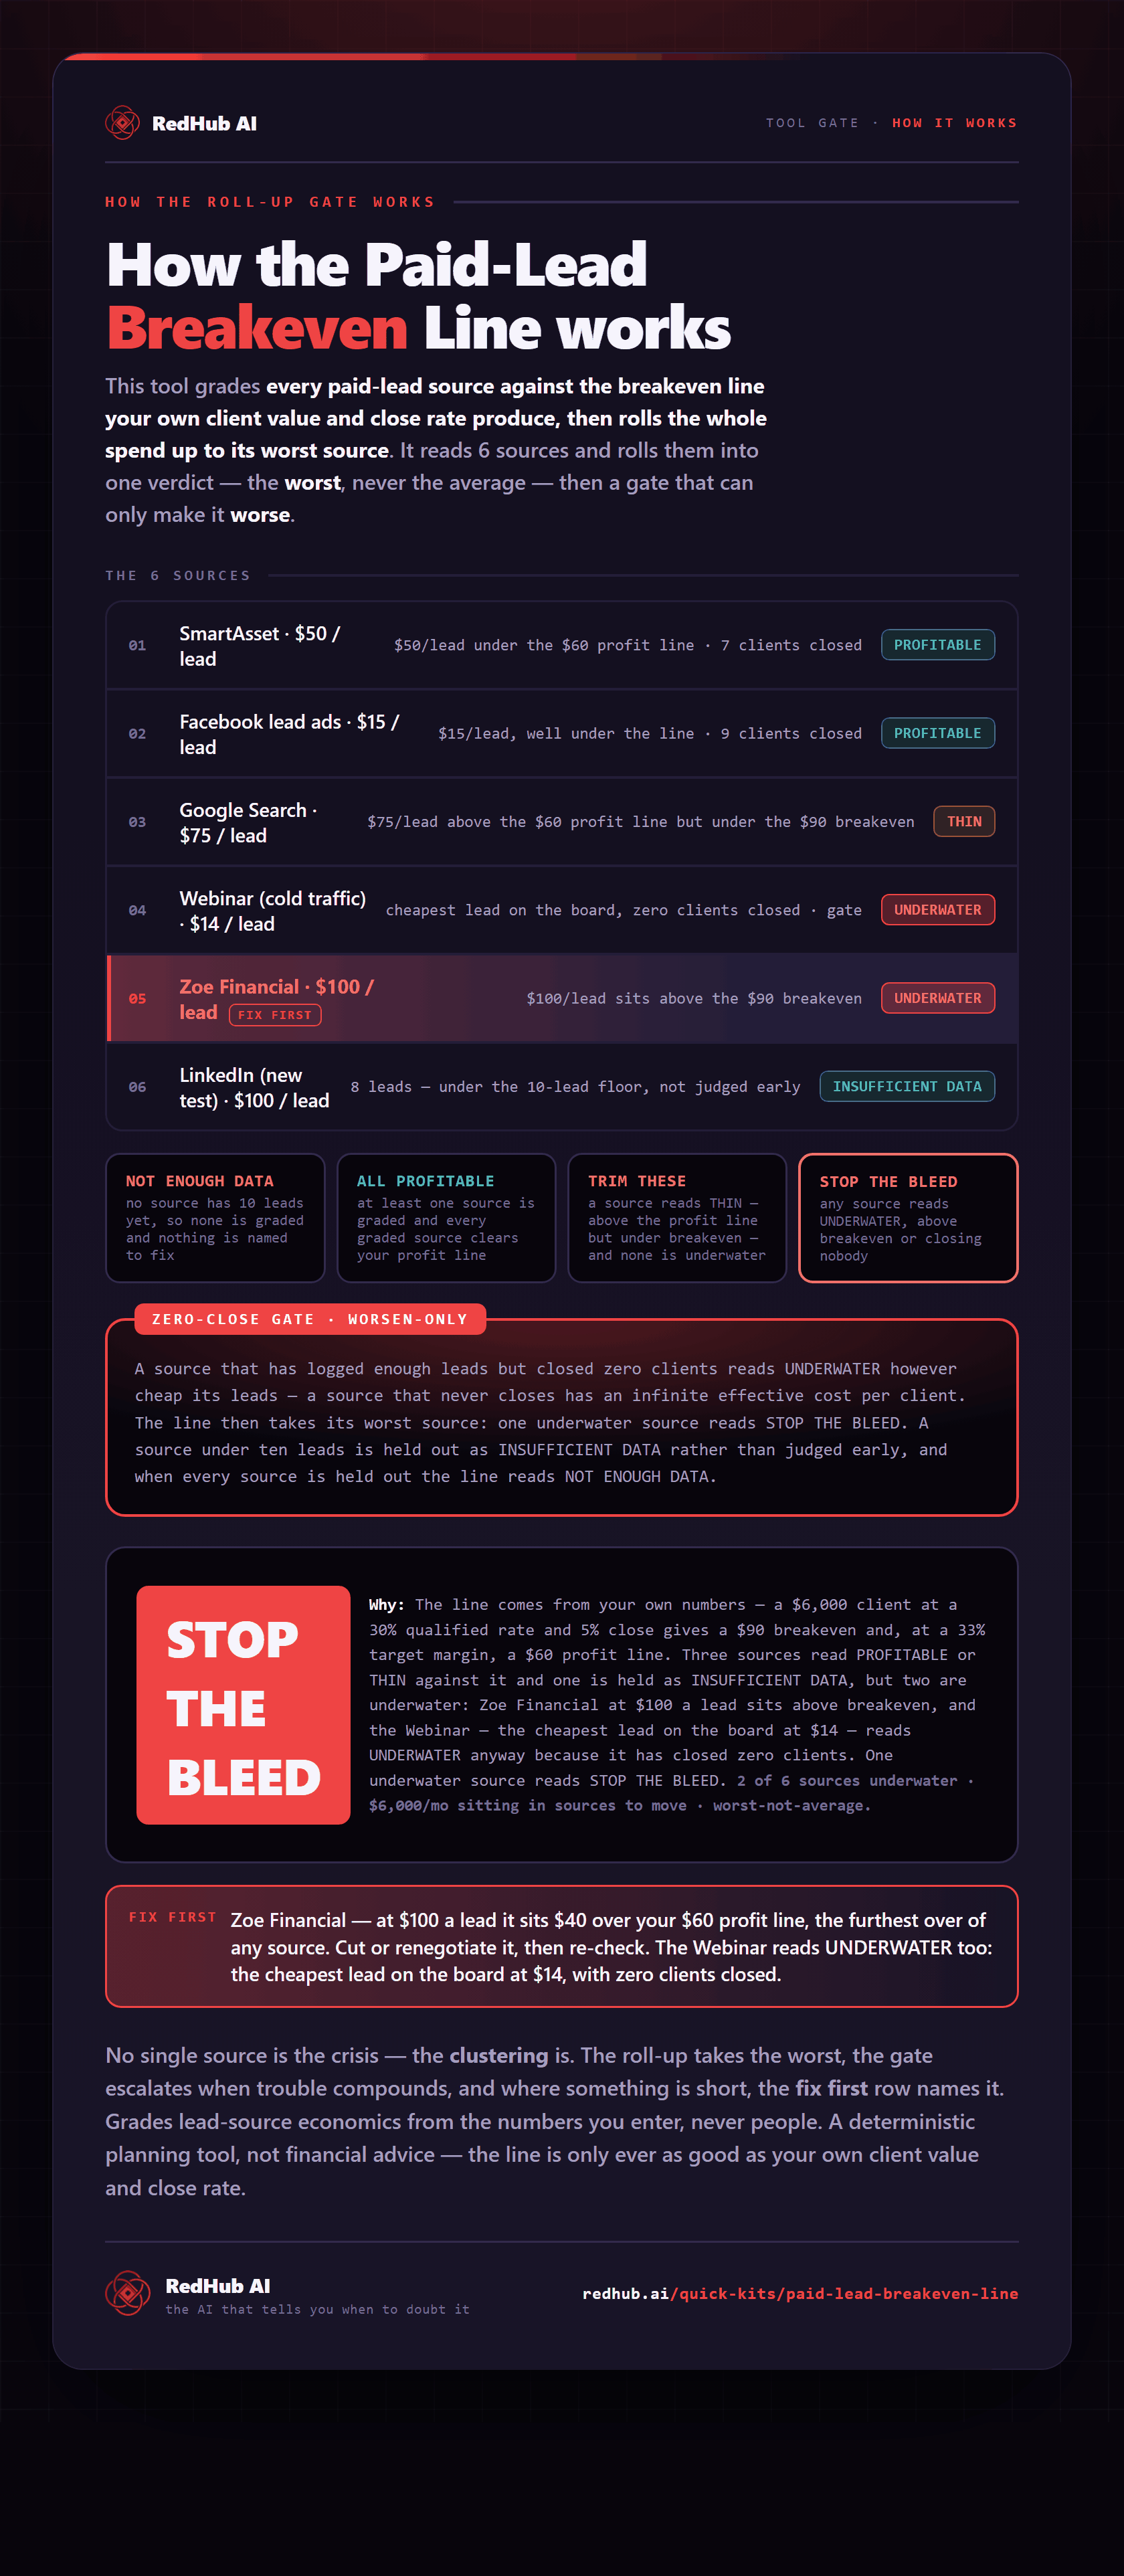
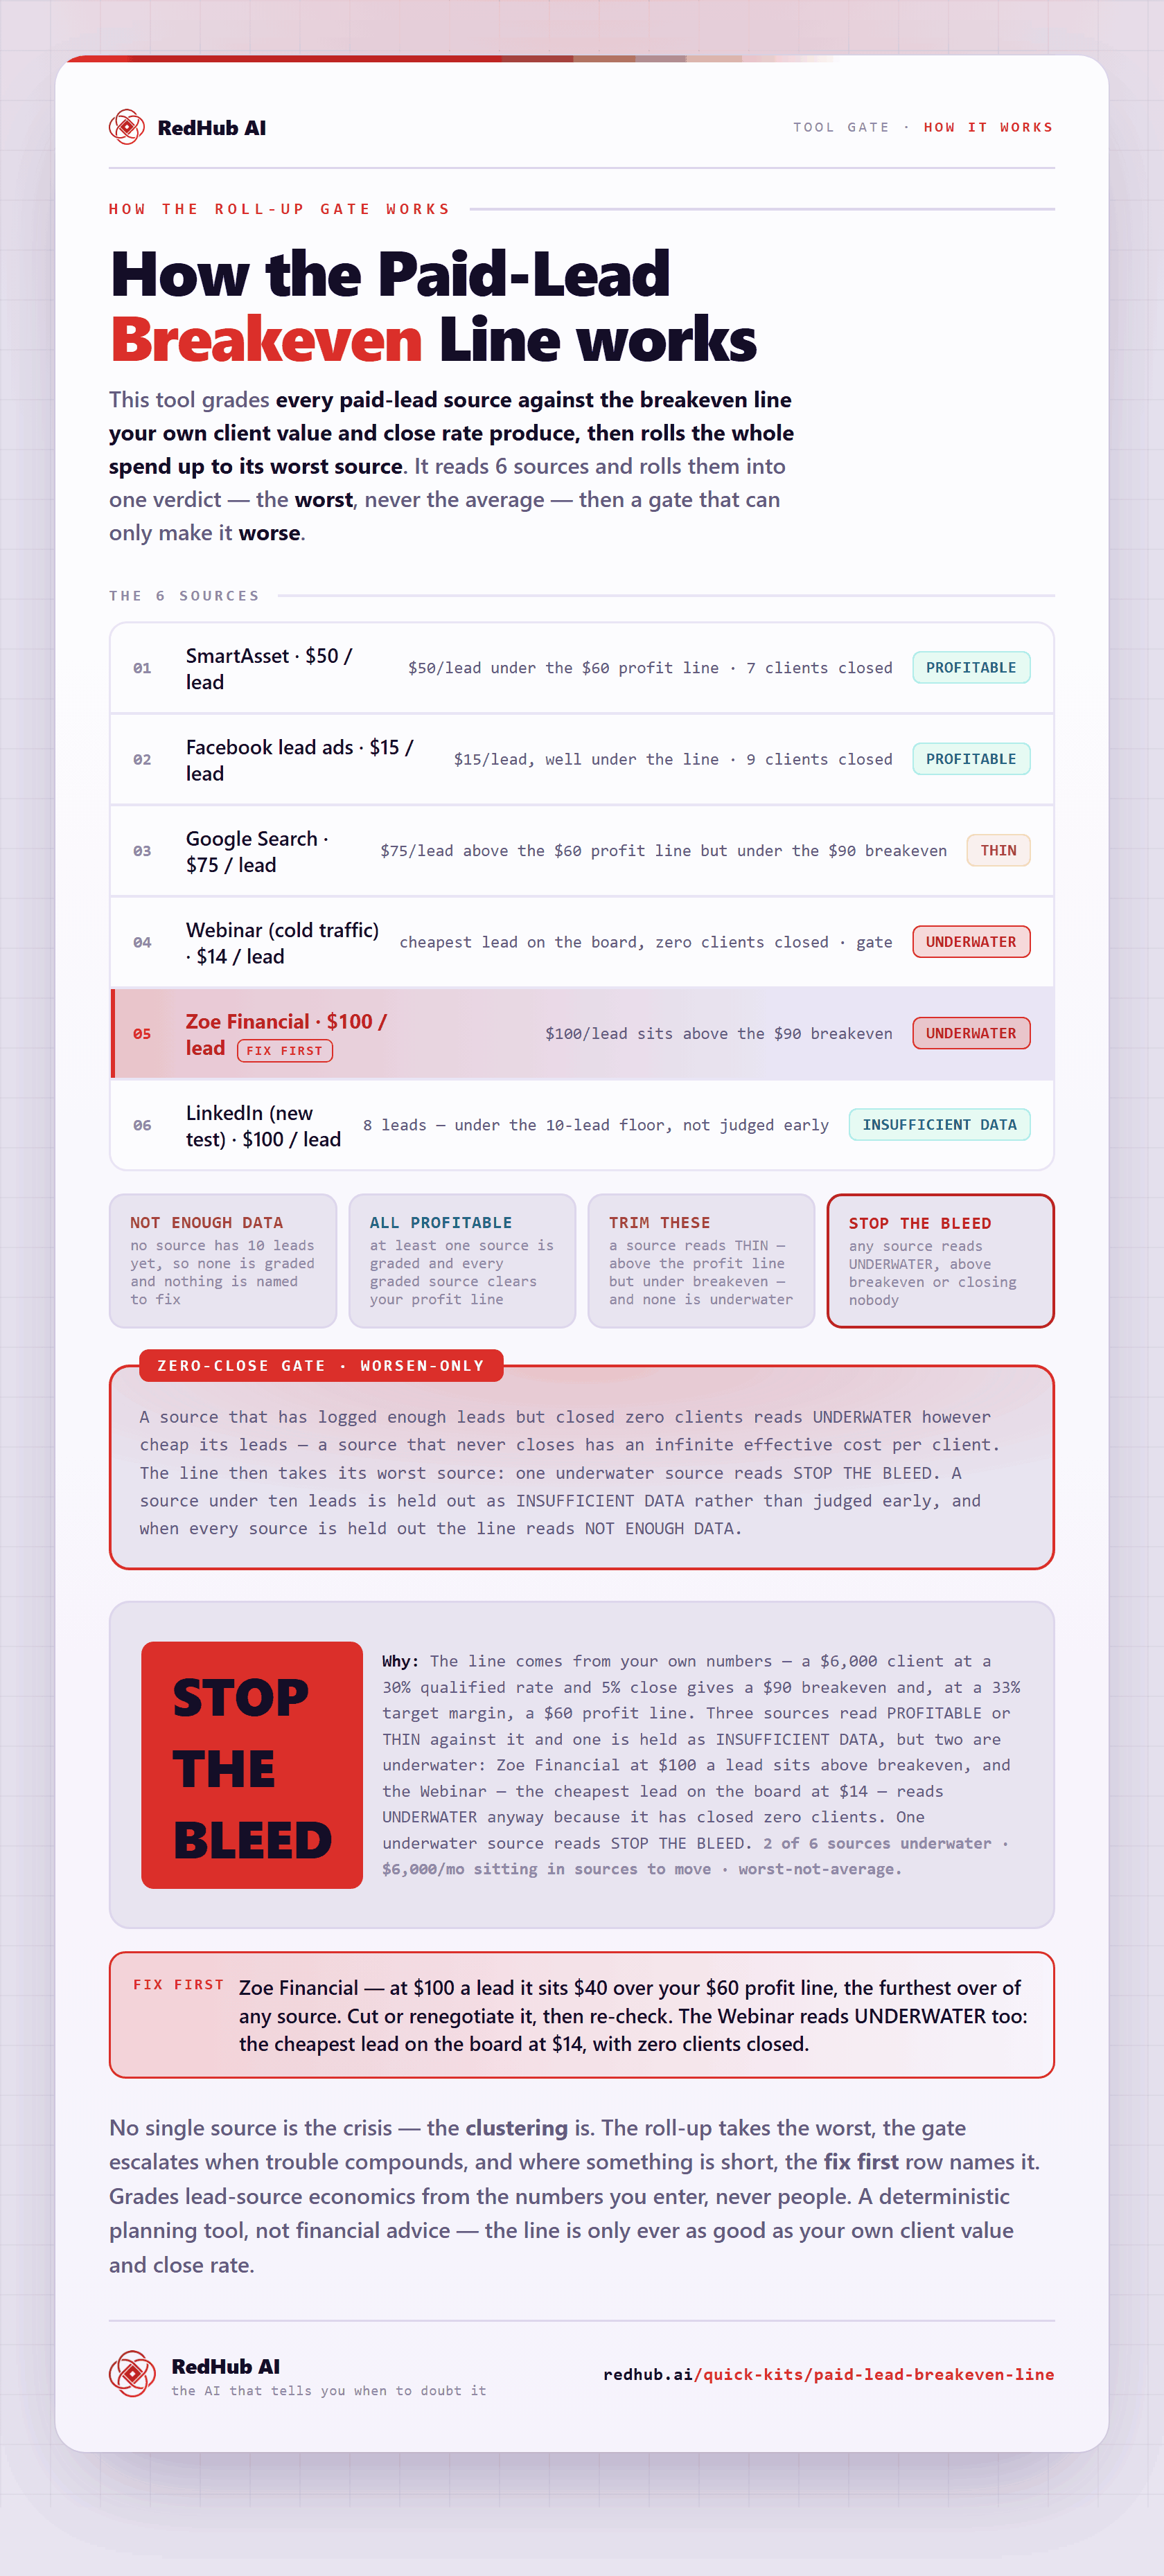
The gate this post refers to, drawn from the tool’s own logic. See the tool.