The Lead-Funnel Metrics That Actually Matter
RedHub AI Editorialupdated October 7, 20266 min read

Jump to a section7
Four lead funnel metrics earn a place on a small dashboard: conversion from each step to the next, response time, lead quality, and cost per booked meeting if you pay for leads. Total traffic and total leads do not make the list. They describe how big the funnel is, and they can double while pipeline stays flat. A metric belongs on the page when a change in it would change what you do on Monday.
TL;DR: Keep ratios and speeds. Drop totals. Judge every number against your own trend, and be careful with rates built on a handful of leads. Cost per lead and cost per booked meeting can rank the same two channels in opposite order. Metrics are evidence for a diagnosis and do not make one alone. The Lead-Gen Funnel Diagnostic ($79) scores six stages from your own ratings and returns FLOWING, LEAKING or CLOGGED. Start with the pillar: The Lead-Generation Funnel: Find Your One Bottleneck.
The test: name the decision
Take any number on your current report and finish this sentence: "If this drops next month, we will..." If you cannot finish it, the number is there for decoration.
Total sessions fails the test for most small firms. A drop might mean a slow season, a lost ranking, or a paused ad, and none of those is a decision the number points to. Lead-to-reached rate passes. If it drops, someone checks who owns new leads and whether the notification still arrives. The metric names its own next step.
The four that pass
- Step-to-step conversion. Visitor to lead, lead to reached, reached to qualified, qualified to meeting. Each rate points at one step. Finding where leads drop off shows the arithmetic.
- Response time. How long a new lead waits for a first real reply from a person. Record the time the lead arrived and the time someone answered, and look at the slowest replies as well as the typical one.
- Lead quality. The share of leads that pass your own qualification rule. A channel that sends many leads and few good ones looks like a success on a volume chart.
- Cost per booked meeting. Spend divided by meetings booked, per channel. It counts everything that happens after the click.
Three of the four are ratios and one is a duration. None is a total.
Cost per lead can rank your channels backward
A team that reports only cost per lead would move budget from B to A and book fewer meetings for the same money. Our post on how to measure marketing ROI without a data team goes further down the same road.
Where the good metrics still mislead
Cost per booked meeting has a timing problem. A lead that arrives in March may book in May. If you divide March's spend by March's meetings, you are crediting March with February's leads. Tying each meeting back to the month its lead arrived fixes that, and it means the number for any month is not final until weeks later. You get a figure that is accurate or a figure that is current, and for a slow sales cycle you rarely get both.
Small counts are the other trap. Channel B's result rests on 10 meetings. If 2 of them had not booked, its cost per meeting would be $250, not $200. That is a 25% swing from two calendar slots. The ranking against A survives here. A closer comparison would not.
A long dashboard does not solve either problem. Fifty columns give you fifty rates that wobble, and the one that matters is somewhere in the middle. Five numbers you check against last month are worth more than fifty you scroll past.
From metrics to a diagnosis
A metric tells you a rate moved. Someone still has to say which part of the operation is behind it. The Lead-Gen Funnel Diagnostic does not import your dashboard. It asks you to rate 18 items from 0 to 5, three for each of six stages, and the metrics are the evidence you rate from.
The fit is close. Its Speed-to-lead stage asks about "fast first touch," anchored at 5 for minutes and 0 for days or never. Your response-time log answers that. Its Source ROI stage asks whether you track cost and yield per source or only a blended figure. If you can build the two-channel table above from your own records, you are not at the bottom of that scale. Where you have no metric at all for a stage, that gap is itself a finding. Then act on the result with one fix at a time, and see the six lead funnel stages for what each stage covers.
Turn the numbers into one stage to work on
The Lead-Gen Funnel Diagnostic scores six stages from 0 to 100 using your own ratings, shows the average for context, and reports the lowest stage as the funnel score: FLOWING at 70 and up, LEAKING from 45 to 69, CLOGGED under 45. Where a stage is short, it names that stage and the kit built for it. No outside benchmark enters the score. It grades stages, not people.
Get the Lead-Gen Funnel Diagnostic — $79Pairs well with
The Lead Source ROI Scorecard ($49) does the per-channel work from the example: it grades each source on qualified-lead rate, cost per qualified lead, close rate and ROAS, and returns SCALE, FIX or CUT. The Inbound Lead Qualification Engine ($99) gives the lead-quality metric a rule to count against, returning PURSUE NOW, NURTURE or DISQUALIFY per lead from your own marks. The MQL to SQL Definition & Handoff Kit ($49) scores the definitions those counts depend on and returns TIGHT, LEAKY or BROKEN.
More in this guide
Which lead funnel metrics matter most?
Conversion from each step to the next, response time, lead quality, and cost per booked meeting if you pay for leads. Each one points at a specific step. Total traffic and total leads describe size and can rise while pipeline stays flat.
What makes a metric a vanity metric?
You cannot name the decision it would change. If a number drops and nobody knows what to do differently, it is on the report for decoration.
Should I track cost per lead or cost per booked meeting?
Cost per booked meeting, where you can. In an illustrative case, a channel at $20 per lead costs $500 per meeting, while a channel at $50 per lead costs $200 per meeting. Cost per lead ranks them backward.
How do I know if a conversion rate is good?
Compare it with your own rate from an earlier period. A rate from another business reflects its traffic, offer and price, and cannot tell you whether yours improved or slipped.
Can I track too many metrics?
Yes. Every added column is another rate that moves from month to month, and the one that matters gets harder to see. Keep the few you check against last month.
How do metrics turn into a fix?
They are evidence for a diagnosis. The Lead-Gen Funnel Diagnostic has you rate six stages from 0 to 5 on three items each, and your metrics inform those ratings. Where a stage is short, it names that stage and the kit built for it.

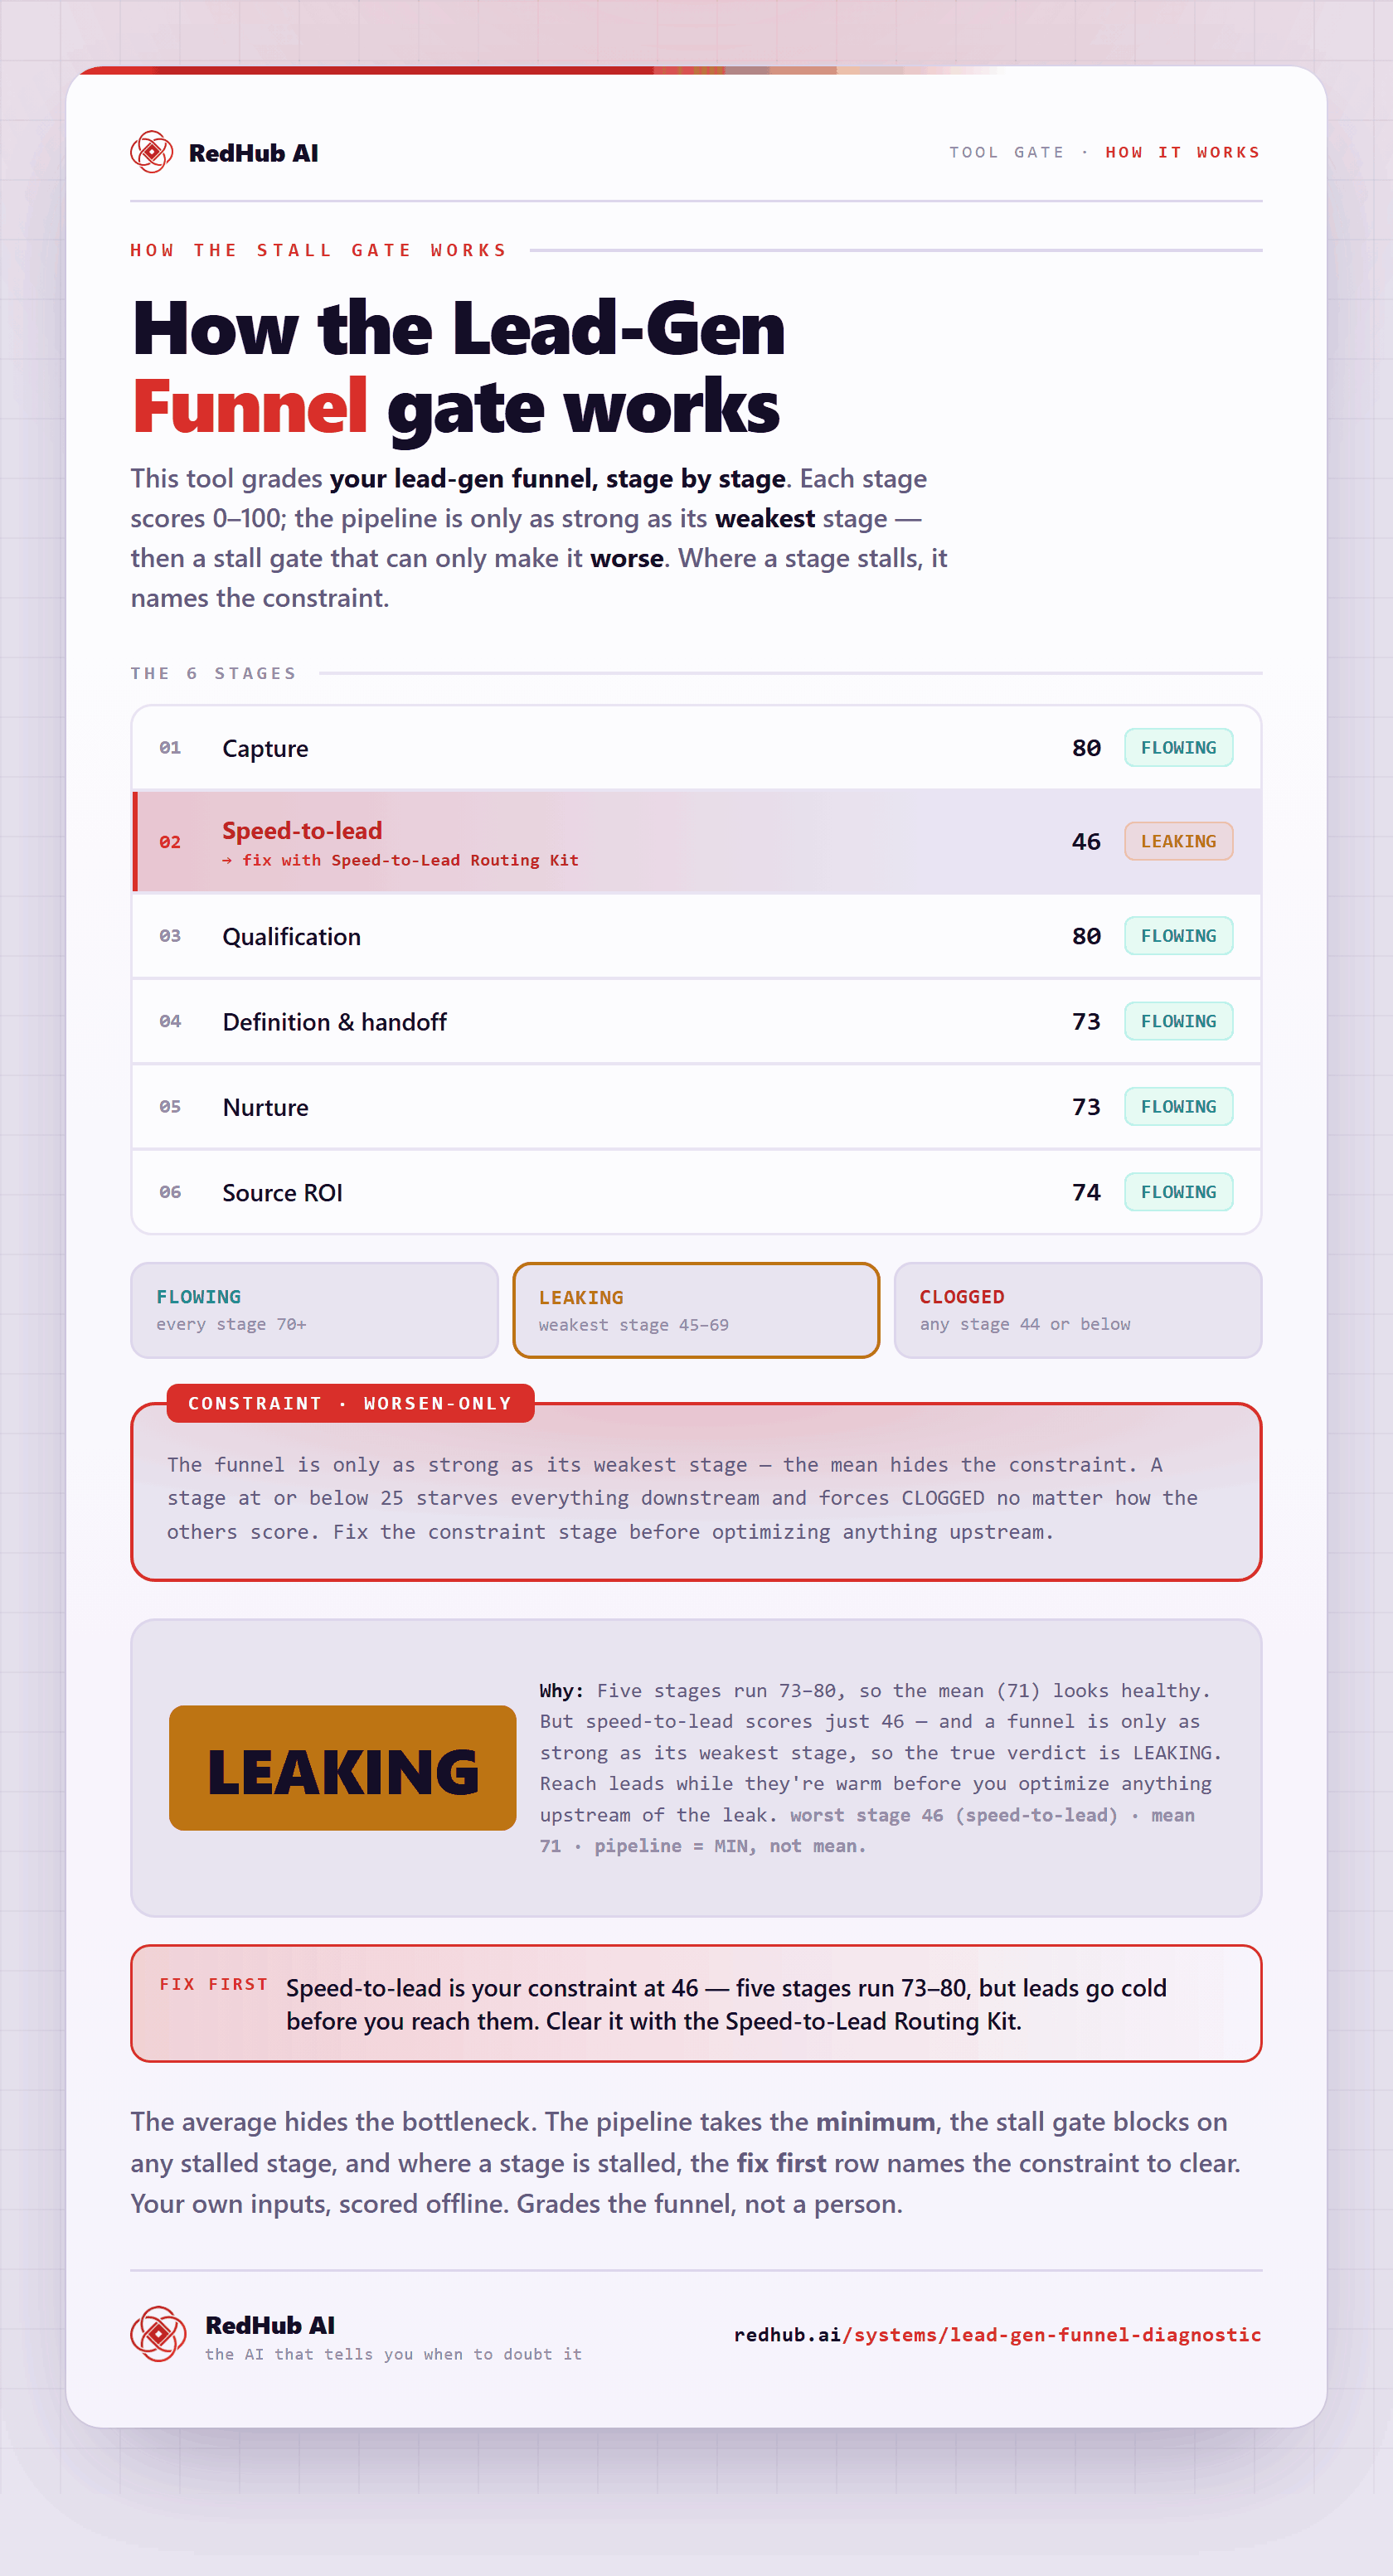
The gate this post refers to, drawn from the tool’s own logic. See the tool.