Price Increase Math: How Much Volume Can You Afford to Lose?
RedHub AI Editorialupdated October 4, 20266 min read

Jump to a section8
- The formula, and why it works
- Worked example: a modest increase at a healthy margin
- Worked example: a bigger jump, thinner margin
- What "margin" means here, and why getting it wrong matters
- Three assumptions to read before you trust the output
- How to use this number in the decision
- Pairs well with
- More in this guide
A 10% raise at a 60% margin can lose one customer in seven and still make the same profit. The rule behind that number is the price increase break even formula: increase % ÷ (gross margin % + increase %), the share of your volume you can lose after a raise before it stops paying off. Lose less than that and the increase pays for itself, real churn included. Lose more and holding the price would have earned more. The math takes two inputs you already have, and it is often more forgiving than the fear.
TL;DR: Break-even volume loss = increase ÷ (margin + increase). At a 60% margin, a 10% increase breaks even at 14.3% volume loss and a 20% increase at 25%. At a 35% margin, a 20% increase breaks even at 36.4%. A lower margin gives more room from the same increase, because each lost sale was worth less. This is an estimate on two inputs. It assumes your margin holds and demand responds smoothly, so treat it as a line to test against, not a forecast.
The formula, and why it works
When you raise your price, every sale you keep earns more than before. The break-even question is how many sales can disappear before that extra profit stops covering what the lost sales used to bring in.
Break-even volume loss = increase % ÷ (current gross margin % + increase %)
Run it in dollars once and the formula stops being abstract. Say you sell a $100 service that costs $40 to deliver, a 60% margin, to 100 customers a month. That's $6,000 of monthly profit. Raise the price 10% and each sale now earns $70. You need $6,000 ÷ $70, or about 85.7 customers, to earn the same $6,000. You can lose 14.3 customers out of 100 and break even, which is exactly 10 ÷ (60 + 10).
Worked example: a modest increase at a healthy margin
A 60% gross margin and a 10% price increase:
| Input | Value |
|---|---|
| Price increase | 10% |
| Current gross margin | 60% |
| Break-even volume loss | 10 ÷ (60 + 10) ≈ 14.3% |
You could lose 14 of every 100 customers and still come out even. Put that next to the loss you expect. If no past price change has cost you more than 5% of customers, you have more than 9 points of room.
Worked example: a bigger jump, thinner margin
Now a 35% gross margin and a steeper 20% increase:
| Input | Value |
|---|---|
| Price increase | 20% |
| Current gross margin | 35% |
| Break-even volume loss | 20 ÷ (35 + 20) ≈ 36.4% |
Two things push the line up here. The bigger increase adds more profit to each sale, and the thinner margin means each lost sale was worth less to begin with. Change one at a time to see each effect: a 20% increase at a 60% margin breaks even at 25%, and a 10% increase at a 35% margin breaks even at 22.2%.
The catch is that a 20% jump is also the kind of increase customers notice. The formula gives you the most room in the scenario where you're most likely to need it. That's a reason to phase a large increase, covered in raising prices without losing customers, rather than a reason to trust the paper room.
What "margin" means here, and why getting it wrong matters
The margin in this formula is the margin on each sale: the price minus the costs that leave with the sale. Materials, payment fees and a contractor paid per job belong in it. Rent and salaried staff you'd pay anyway don't. That is usually close to your gross margin and never your net margin after overhead.
A wrong input moves the answer. For a 10% increase, a 50% margin breaks even at 16.7% volume loss, 60% at 14.3% and 70% at 12.5%. If you aren't sure which of those you are, confirm the margin first. The output is only as reliable as the number you put in.
Three assumptions to read before you trust the output
- Margin holds steady. If the increase creates new costs, such as more support demand or a competitive response that raises what you spend to win customers, your real margin shifts after the fact.
- Demand responds smoothly. Customers don't leave in a straight line. Cross a price point that matters to them, like a round number or a competitor's exact price, and you can lose a cluster at once.
- It's a blended average. Your most loyal customers and your most price-sensitive ones don't behave the same way. The blended line can look safe while one segment is well past its own limit.
None of this makes the math wrong. It makes the output the line you test against. Where your break-even room allows the delay, try the increase on one segment before rolling it out to everyone.
How to use this number in the decision
Run your real increase and real margin through the formula. Compare the result with the churn you've seen from past changes, or with a cautious estimate if you've never raised prices before. If your expected loss sits comfortably below the line, the case for raising is strong. If it's close to the line or above it, hold and test, restructure the offer instead of the price, or fix margin first. Our pillar post on deciding whether to raise your prices walks through those verdicts, and when to raise prices covers the signals that start the question.
Model every increase side by side
The Should I Raise My Prices? Decision Kit works from your price, unit cost, monthly units and expected loss. It lays out +5% through +25% with the new price, the loss each step can absorb, projected profit and a Raise, Hold / test or Restructure verdict per step.
Get the Should I Raise My Prices? Decision Kit — $49Pairs well with
The Margin Leak Auditor ($79) sweeps your deal book for realized margin below your floor and returns HOLD or CLEAR, so the margin you plug in is one you've checked. The Profit Leak Finder ($49) ranks every client by true profit after the cost to serve, with a keep, reprice, fix or fire verdict, which shows the segments a blended average hides. The Discount & Promo Profit Analyzer ($39) runs the question the other way, pricing every discount against running no promo at all and returning keep, limit or kill.
More in this guide
What is break-even volume loss in pricing?
It's the largest share of customers or sales you can lose after a price increase and still make the same profit. It equals the increase percentage divided by the sum of your current margin percentage and the increase percentage.
How do I calculate break-even for a price increase?
Divide your price increase percentage by your current gross margin percentage plus the increase percentage. A 10% increase at a 60% margin breaks even at about 14.3% volume loss: 10 ÷ 70.
Does a bigger price increase mean more risk?
Not in the formula, where a larger increase raises the break-even line. In practice, bigger jumps are more likely to cause noticeable churn, so phasing a large increase is often the safer route.
Should I use gross margin or net margin in this formula?
Use the margin on each sale: the price minus the costs that disappear when that sale disappears. That's usually close to gross margin. Never use net margin after overhead, because overhead doesn't leave when a customer does.
Is this break-even calculation guaranteed to be accurate?
No. It's an estimate that assumes your margin holds and demand responds smoothly to the change, and neither is guaranteed. Treat it as the line you test against, and try the increase on one segment before rolling it out fully.
What if I don't know my actual gross margin?
Confirm it before you trust the output, because a 10-point error in margin moves the break-even line by about 2 points for a 10% increase. A tool that computes realized margin from your own deal records, such as the Margin Leak Auditor, beats a rough guess.
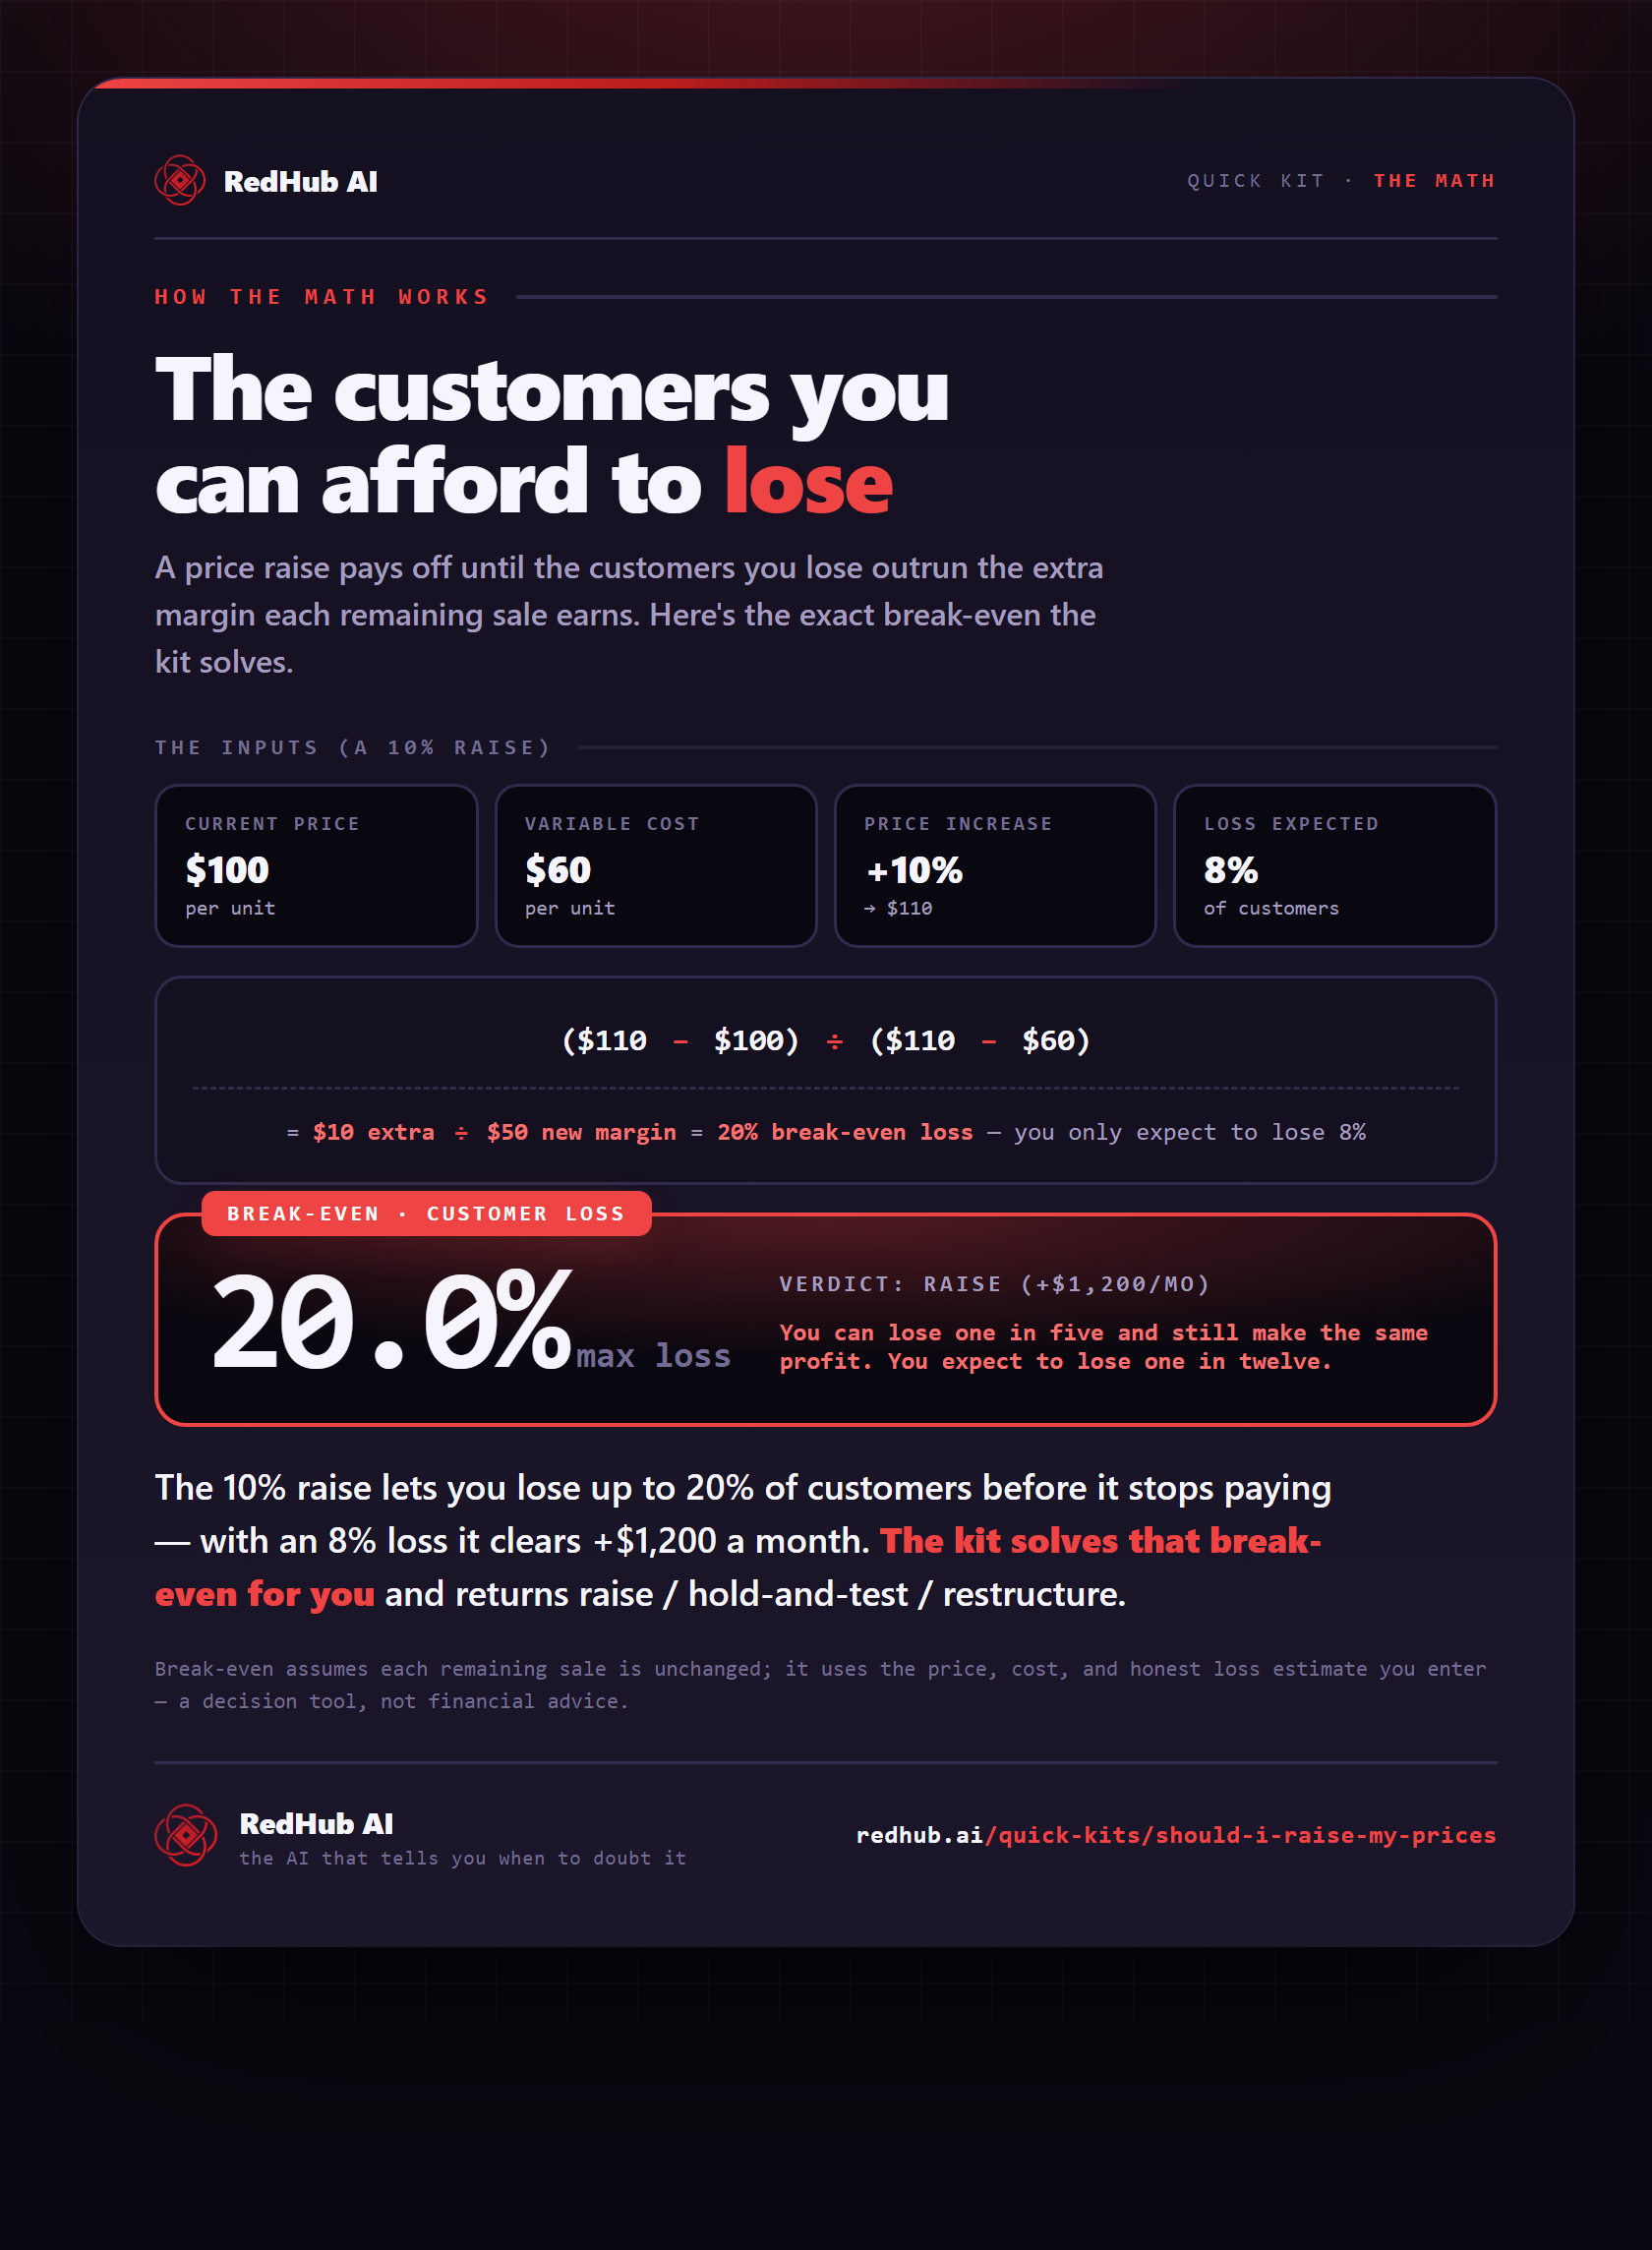
The gate this post refers to, drawn from the tool’s own logic. See the tool.