Audience Retention: How to Read Your Retention Graph
RedHub AI Editorialupdated September 7, 20266 min read

Jump to a section11
TL;DR
- What it is: audience retention is the graph showing what percent of viewers are still watching at every point in your video.
- What it tells you: where viewers actually leave — the intro, the middle, or a natural late-video slope.
- How to fix it: each drop type has a different cause — a packaging mismatch, sagging pace, or just a normal late-video decline.
- Bottom line: retention is the gate. No amount of packaging fixes a video people leave once they've clicked.
What is audience retention on YouTube?
Audience retention is the percentage of a video's audience still watching at each point along its length, shown as a graph in YouTube Studio's analytics. It's the clearest signal of whether a video is delivering on what its packaging promised. A steep drop in the first 30 seconds usually points to a packaging mismatch; a drop in the middle usually points to pacing or a wandering structure; a gradual decline toward the end is normal on most videos. Reading the shape of the graph — not just the average — tells you which problem you actually have.
Best for: anyone trying to figure out whether a slow-performing video needs a new thumbnail or a re-cut. The YouTube Packaging & Retention Engine ($99) uses your average percentage viewed as the gate that decides SHIP, TIGHTEN, or REWORK.
Click-through rate tells you whether packaging earned the click. Audience retention tells you what happened after — whether the video kept the promise. Of the two, retention is the one that matters more, because a video with weak retention can't be fixed by a better thumbnail. The packaging already did its job; the video is where the problem lives.
This post is part of our YouTube packaging series — retention is the gate the whole system is built around.
What the retention graph is actually telling you
YouTube Studio's Audience Retention tab plots what percent of viewers are still watching at every second of your video. It never starts at 100% for long, and it never stays flat — the shape is what matters, not the raw number. A steady, gradual slope is normal. A steep vertical drop at a specific point is a signal: something happened there that lost a chunk of your audience all at once, and that timestamp tells you where to look.
Illustrative shape only — not measured data. Your own graph lives in YouTube Studio, under each video's Audience Retention tab.
The intro cliff (first 30 seconds)
A steep drop right at the start almost always points back to packaging, not the video itself. Viewers clicked expecting one thing and the open didn't deliver it fast enough — or at all. A slow wind-up, a greeting, or a topic that doesn't match the title's promise all show up here. Check the timestamp against your title and thumbnail before you touch the middle of the video.
The mid-video dip
A drop in the middle usually means the video's pace sagged or wandered off the promise the packaging made. A section that repeats an earlier point, a tangent that doesn't serve the title, or simply too much setup before the payoff all create this shape. Cut the section that sits right before the drop and see if the payoff can move earlier.
The re-engagement bump
Sometimes retention ticks back up mid-video instead of only falling. That's a real signal too — something re-hooked viewers who were drifting. A pattern-interrupt, a new visual, or a specific promise being paid off can all cause this. Note what happened right before the bump; it's a pattern worth repeating deliberately in future videos.
The end drop
Most videos lose viewers steadily toward the end, and that's expected — not every viewer who started needs to finish for the video to have done its job. What separates a normal end drop from a problem is the shape: a gradual slope is fine, a sudden cliff right before your strongest content usually means the middle lost people before they got there.
Key insight: a high click-through rate paired with a steep intro cliff is the exact mismatch the packaging pillar warns about — the thumbnail and title overpromised, and the algorithm reads the pattern as a broken promise. Retention is the gate; no packaging edit clears it once the video itself is the problem.
Match the drop to the fix
| Drop type | Likely cause | What to check |
|---|---|---|
| Steep drop in first 30 seconds | Packaging mismatch — the open doesn't deliver the title's promise | Compare the timestamp against your title and thumbnail |
| Steady drop mid-video | Pacing sags, or content wanders from the promise | Cut the section right before the drop; move the payoff earlier |
| Bump mid-video | Something re-hooked drifting viewers | Note what happened right before it and repeat the pattern deliberately |
| Gradual slope toward the end | Normal — most videos lose viewers steadily near the end | Only worry if the slope turns into a sudden cliff |
How to read your own graph in three minutes
- Open YouTube Studio, select the video, and go to the Audience Retention tab.
- Find the steepest drop on the graph — that's your biggest single problem, not the overall shape.
- Check the timestamp against what happens in the video there — does it match a packaging mismatch, or a pacing issue?
- Fix one thing on the next video — the open, a section's pace, or the payoff's placement — and compare the next graph to this one.
A video with a REWORK-level retention problem needs a content fix, not a new thumbnail. If you've ruled out the video and the click-through rate is still the issue, that's a packaging problem — start with how to design a YouTube thumbnail and how to write a YouTube title. And once you're testing new packaging ideas, check the results honestly with YouTube A/B testing: how to call a real winner.
Know exactly where viewers leave — and why
The YouTube Packaging & Retention Engine ($99, one-time) indexes every video's average percentage viewed to your own channel baseline, so a REWORK verdict tells you the video needs a fix, not the packaging.
Get the Engine — $99 →If the real bottleneck is knowing what to make next so each video has a stronger structural spine going in, the Content Engine for One Person ($39) is a lightweight planning system worth pairing with this.
Decision Guide
Use this approach if: a video is underperforming and you're not sure whether the packaging or the content is the actual problem.
Skip it if: your retention is already strong and click-through rate is the bottleneck — start with the thumbnail and title guides instead.
Best first step: open your three lowest-performing videos in YouTube Studio's Audience Retention tab and find the steepest drop in each before you change anything.
FAQ
What is audience retention?
The percentage of viewers still watching at each point in your video, shown as a graph in YouTube Studio. It's the clearest signal of whether the video delivers on what its packaging promised.
What causes a steep drop at the start of a video?
Usually a packaging mismatch — the title or thumbnail promised something the opening seconds don't deliver, or a slow wind-up wastes the attention the click earned.
Can a new thumbnail fix low retention?
No. A thumbnail only affects whether someone clicks. Once retention is low, the problem lives in the video itself — the open, the pacing, or the payoff — and needs a content fix, not a packaging one.
Is a drop toward the end of a video a problem?
Usually not, if it's a gradual slope — most videos lose viewers steadily near the end. It's only a concern if the slope turns into a sudden cliff before your strongest content.
What does average percentage viewed mean?
The average share of a video's total length that viewers watch. It's the single number most tools use to compare retention across videos, though the full graph shows where the drops actually happen.
Is a high click-through rate always good?
Only if retention holds too. A high click-through rate paired with a steep retention drop is a warning sign, not a win — the packaging overpromised and the video didn't deliver.
How often should I check my retention graph?
After every upload, at minimum for videos that underperform your channel average. Catching a repeat pattern — the same drop point on multiple videos — is more valuable than reviewing any single video in isolation.
Find out if it's the packaging or the video
The Engine indexes every video's retention to your own baseline and never tells you to scale a video that's actually losing its audience. One-time $99, instant download. 30-day guarantee.
Get the YouTube Packaging & Retention Engine — $99 →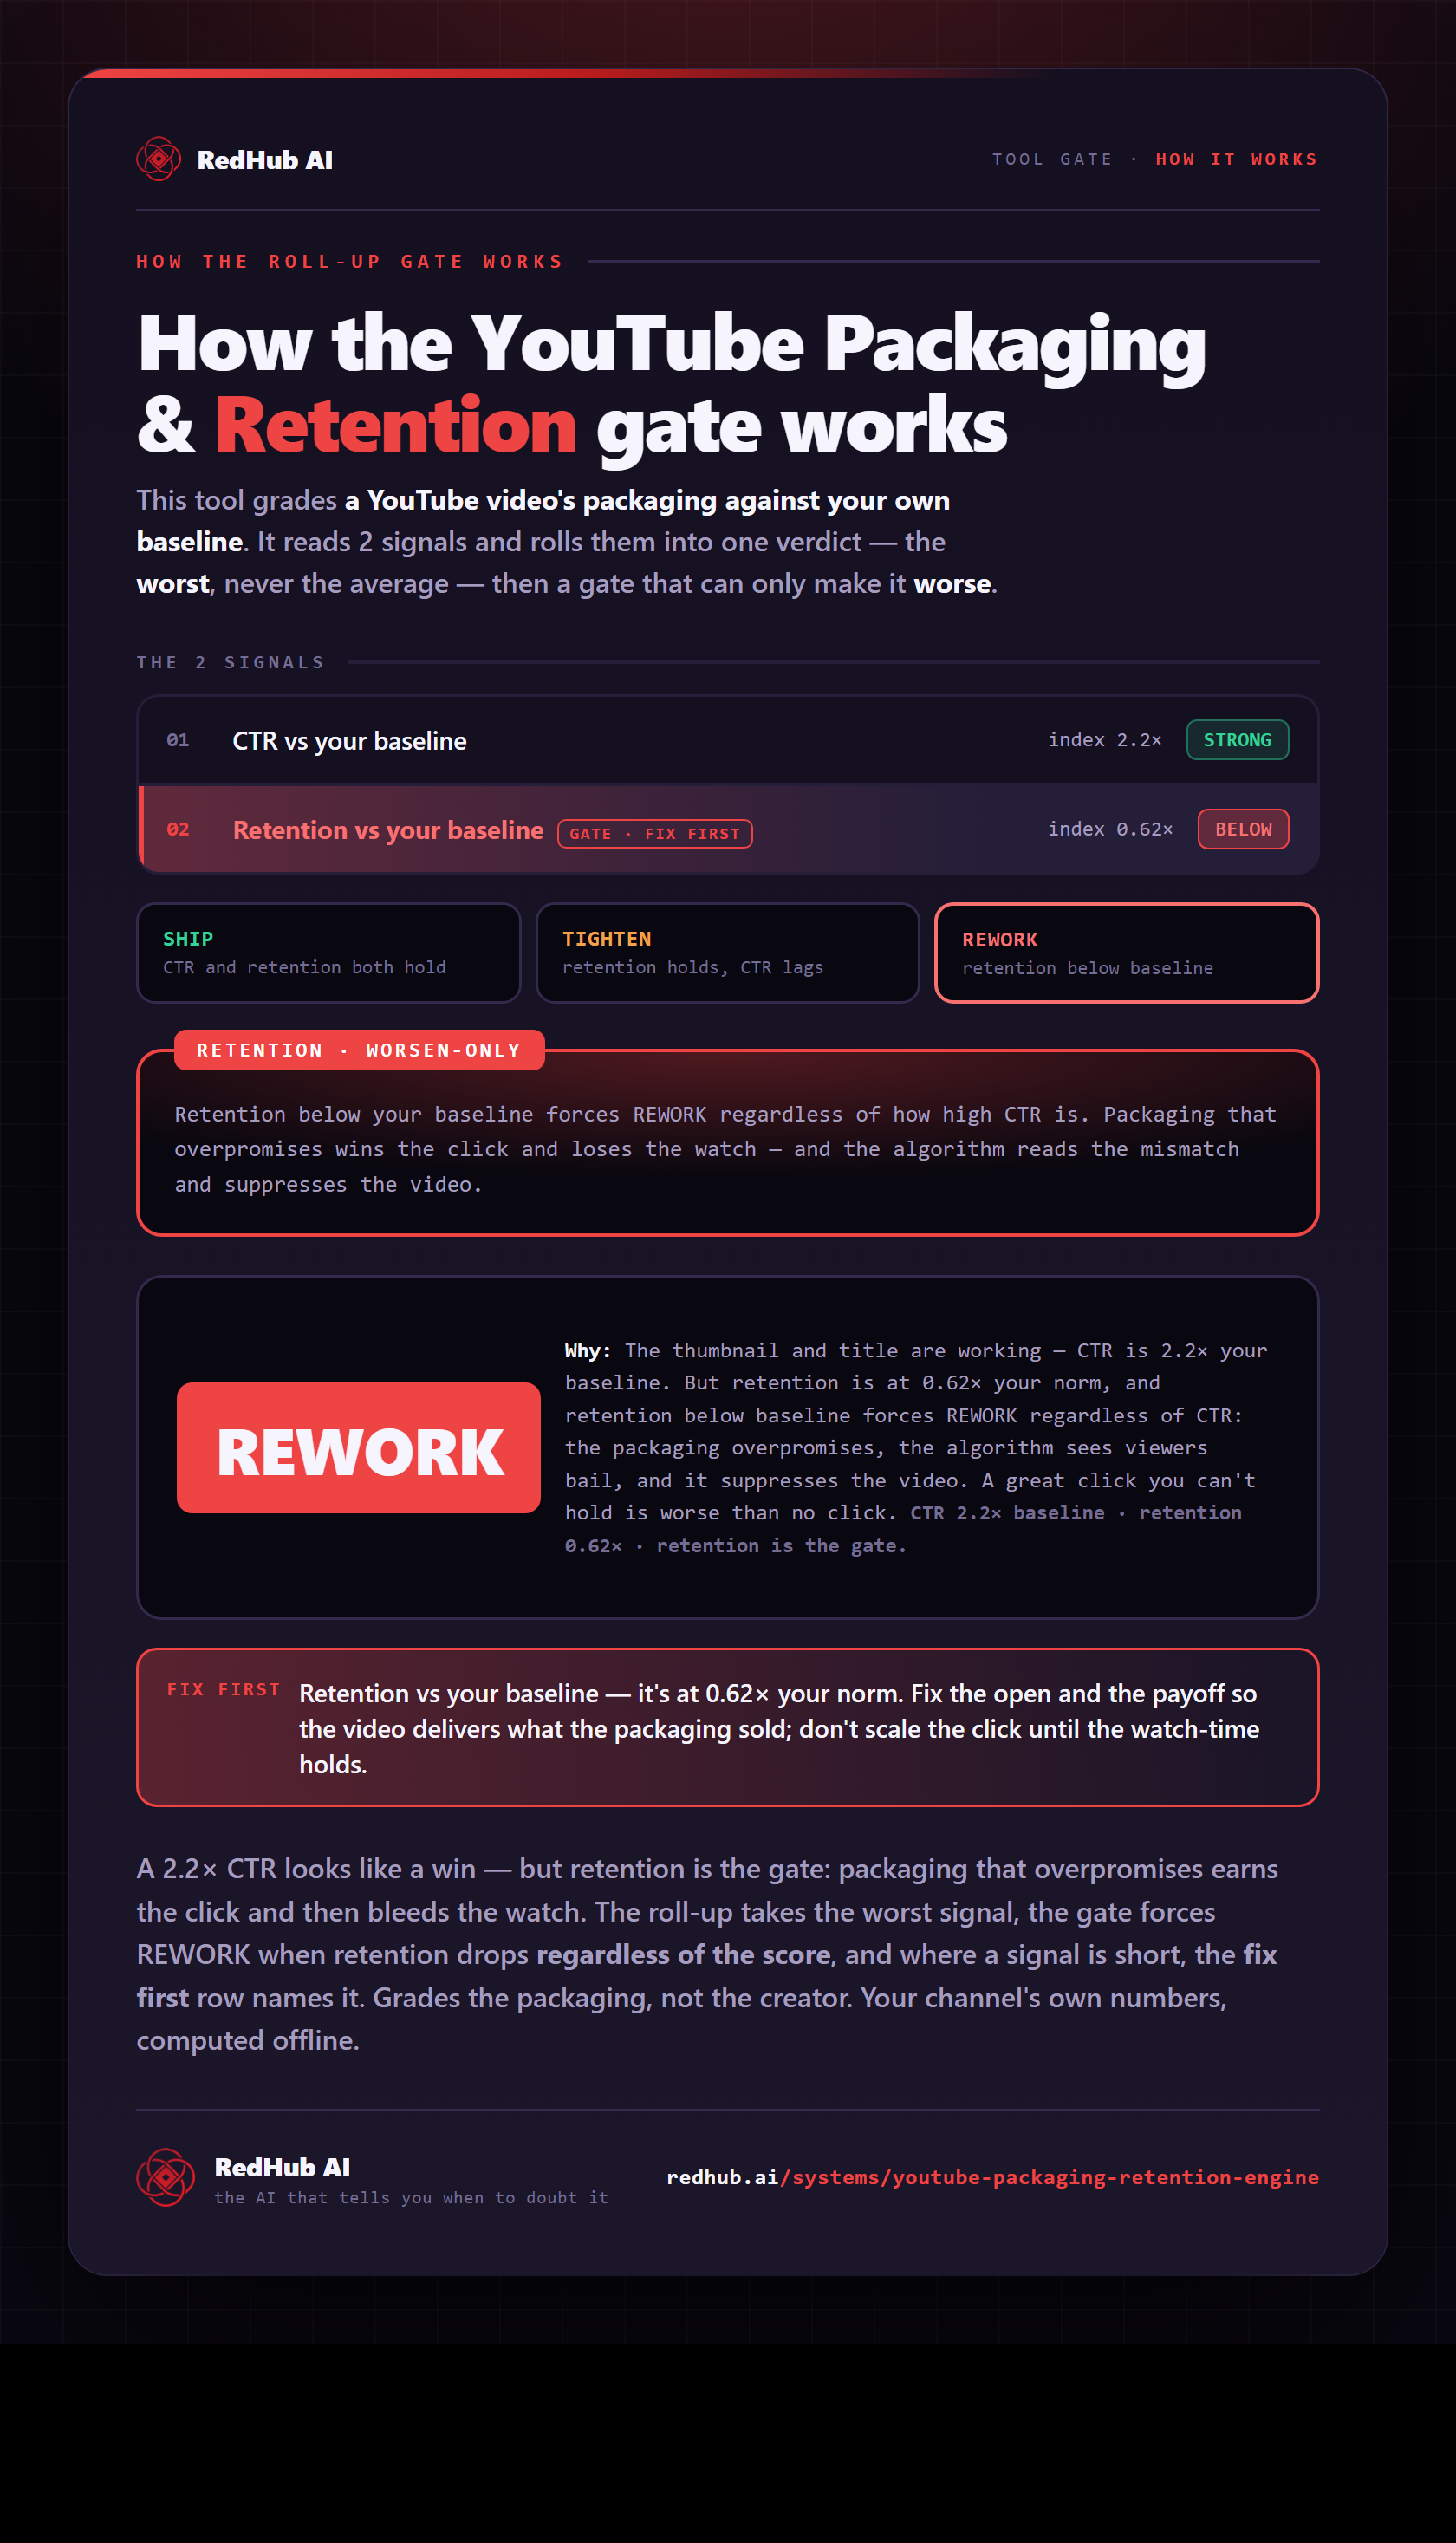
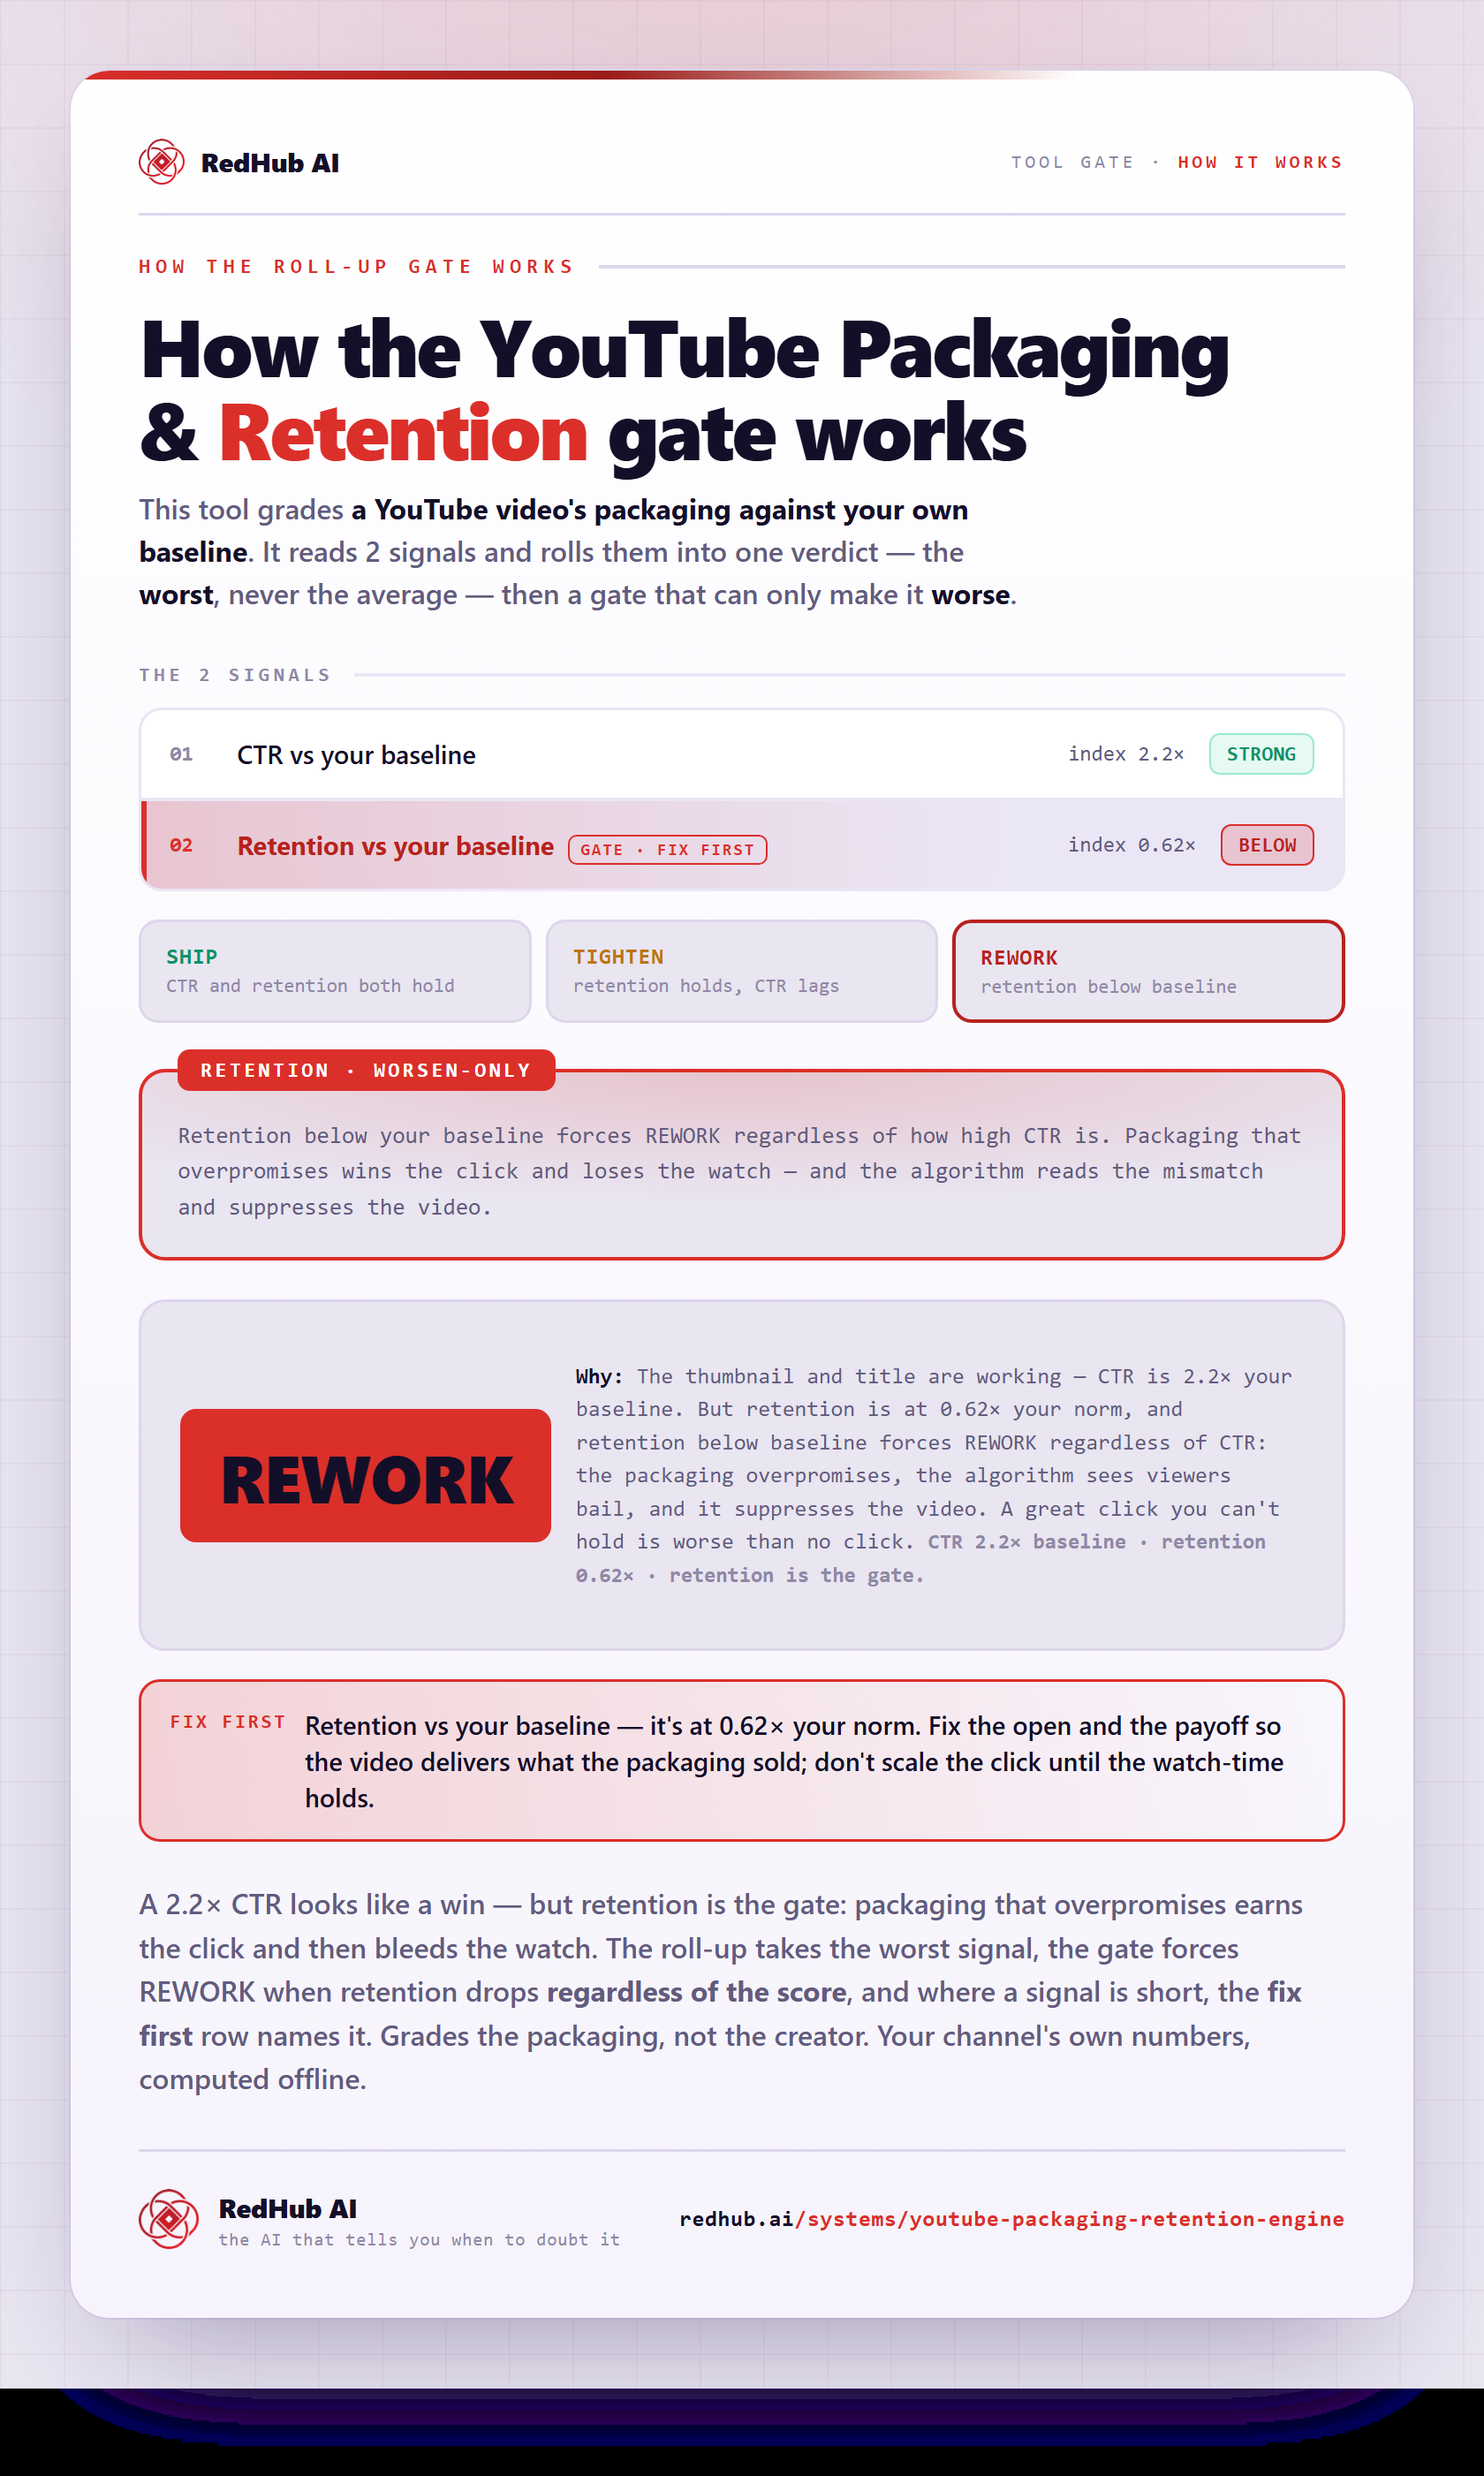
The gate this post refers to, drawn from the tool’s own logic. See the tool.